
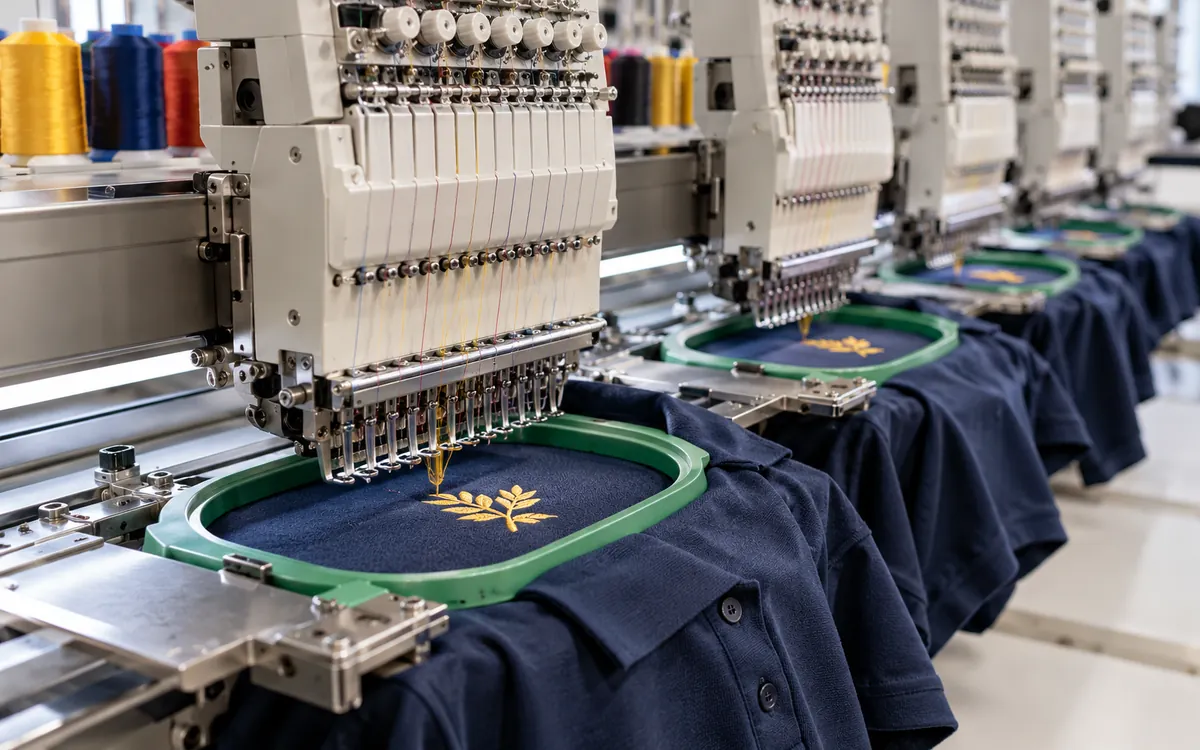
Embroidery costing works best when it follows the way the order will run. Two designs can contain the same number of stitches and use the same thread. One may still take much longer. It may need more stops, slower sections, awkward loading or a manual placement.
A price per thousand stitches can help with a first enquiry. A production quote needs more detail. What does it cost to complete the approved design on the available machine? Work this out for the actual order quantity.
This guide uses original examples with made-up figures. The rates and times are teaching figures, not market prices or recommended factory targets.
Define exactly what the quote covers
Start with a job description that another person could use without guessing. Record the garment, embroidery location and artwork size. Add the design version, colour sequence and order quantity. State whether the quantity means garments, embroidered placements or sets.
A shirt with a chest logo and two sleeve marks has three placements. It may need several loading steps. This remains true even if one person handles the shirt throughout. Counting only shirts can conceal much of the work.
Record the supplied condition as well. Embroidering an open panel can be easier than reaching the same position on a finished garment. A lining, pocket, zip or narrow opening may limit access. These features can change the usable frame, head spacing and time needed to protect the garment.
Make clear who supplies the garments and who owns damaged pieces. The decoration price may exclude the value of the customer’s garment. If so, agree who pays for damage. It should not quietly treat a rejected premium jacket as a few cents of thread.
The first quote can contain assumptions. Label them. Replace assumptions with approved design and sample evidence. Do this before making a firm production commitment.
Use stitch count as one cost driver
Stitch count describes the number of programmed stitches. It does not describe every second the machine or operator will spend on the job.
Wilcom’s embroidery pricing guidance identifies several separate price drivers. These include quantity, setup, garment type, embroidery position, colours and special operations. This supports a quote with distinct inputs. One unexplained stitch rate leaves those inputs hidden.
Consider two hypothetical designs, each containing 18,000 stitches.
Feature | Design A | Design B |
|---|---|---|
Main construction | Continuous fill and simple text | Small text, short elements and appliqué |
Manual intervention | None during the run | Stop to place appliqué |
Access | Flat cut panel | Finished sleeve |
Loading | Easy to position | Requires care around the opening |
Cost implication | Relatively simple cycle | More handling and interruption |
The identical stitch count does not make their costs equal. Nor does the larger visual design always cost more. A small dense mark can have many stitches. An open line design may cover a wide area with fewer.
Keep a stitch-rate price table only if it reflects the shop’s recent work. Use separate groups for job types that behave differently. Check the table when garment mix, machine use or loading methods change.
Separate an artwork estimate from a production file
An enquiry may arrive as a picture rather than an embroidery file. The supplier must estimate how that picture will become stitches. Decisions about density, underlay, stitch type and small lettering remain open.
Wilcom’s estimate workflow asks users to set design dimensions and uses the organisation’s price tables. The estimate depends on how the artwork becomes stitches. It also depends on the price rules the business enters.
Treat this as a provisional commercial stage. State the assumed finished dimensions, number of colours and decoration method. Explain which changes require a revised quote.
Once the design is digitised, confirm the production stitch count and sequence. Then sew a relevant sample. A file may look efficient on screen. It may still need changes to avoid poor coverage, puckering or damage.
Do not reduce density simply to reach a quoted cost. First decide whether the approved appearance and performance can survive that change. A cheaper file that creates rejected garments can increase total cost.
Build the machine cycle from observed events
The useful cycle is the time between equivalent points in repeated production. For example, measure from the start of one batch of loaded garments to the start of the next batch.
Define the boundary before timing. One observer may include unloading. Another may start with fresh garments already in place. Define the boundary to avoid this mismatch.
A practical cycle record separates these events:
Event | What to record |
|---|---|
Stitching | Elapsed sewing time for the complete file |
Programmed stops | Colour changes, trims and pauses within the program |
Manual work during a stop | Appliqué placement or another required action |
Garment exchange | Unloading, loading and checks that hold the machine |
Recurring interruption | Observed thread breaks or faults under the agreed conditions |
Some events overlap. An operator may prepare the next hoop while the machine runs. Do not add that preparation to machine occupancy if it does not delay the next cycle. It still uses labour time.
Measure several normal cycles after setup is stable. Keep abnormal events visible rather than deleting them without explanation. A broken tool may stop a whole shift. A trim fault may recur on every design. Keep these two types of loss separate.
Why nominal speed is insufficient
Divide stitches by the machine’s maximum speed for an idealized estimate. This assumes that speed is maintained and leaves out other time. It does not account for changes in actual speed, programmed functions or loading.
For an 18,000-stitch design at an assumed 900 stitches per minute:
Idealised stitching time = 18,000 ÷ 900 = 20 minutes.
That is not yet the production cycle.
Machine capability also depends on the technique. Tajima’s TLMX specifications give different model-specific speed limits for taping, zigzag swing and coiling. A single maximum speed cannot represent every operation on a mixed decoration order.
Count the heads that can actually produce
A six-head machine does not always yield six acceptable garments per cycle. The job may use fewer heads. Frame size, spacing, garment bulk or maintenance may limit the count. A small balance quantity can leave heads empty too.
Record usable heads for this design and loading method. Distinguish installed heads from occupied heads and successful placements.
For a conventional multihead run, a shared cycle often serves several copies of the design. Check that all installed heads provide the expected output. Only then can the full cycle be divided by that head count.
Special machines need closer reading. Tajima’s TCMX information describes combined decoration capabilities and notes that operating conditions depend on the application. Head type, embroidery field and machine configuration matter. A catalogue count alone is not a capacity model.
This is also why a supplier should avoid a universal “multihead discount.” Large quantities help only when the work can fill the equipment and run consistently.
Worked example: cost a measured cycle
Assume a hypothetical shop observes the following stable cycle:
Item | Value |
|---|---|
Stitching and routine programmed functions | 28 minutes |
Garment exchange that stops the machine | 4 minutes |
Complete occupied cycle | 32 minutes |
Usable, occupied heads | 5 |
Accepted proportion of attempted placements | 96% |
Machine cost allocation | 18 currency units per occupied hour |
Dedicated operator cost allocation | 12 currency units per occupied hour |
The machine has six installed heads, but this garment arrangement uses five. The operator is assigned to this machine for the period being costed.
Attempted placements per hour = 60 ÷ 32 × 5 = 9.375.
Expected accepted placements per hour = 9.375 × 0.96 = 9.
Combined occupied-hour cost = 18 + 12 = 30 currency units.
Conversion cost per accepted placement = 30 ÷ 9 = 3.33 currency units.
Suppose recurring decoration materials cost 0.20 per attempted placement. Their expected cost per accepted placement is:
0.20 ÷ 0.96 = 0.208 currency units.
The recurring cost is about 3.54 per accepted placement. This excludes setup for the order. It also excludes any separately stated garment liability.
The 96% figure is an assumption for this example. A real quote needs relevant yield evidence. State whether rejected pieces can be repaired. Check whether the measured cycle already includes that repair work.
Avoid charging the same lost time twice
The previous cycle already includes its routine programmed functions and garment exchange. Adding another blanket allowance for those same events would count them twice.
Likewise, the dedicated operator’s hourly allocation covers the full occupied period in this example. Adding all loading labour again would overstate that labour cost.
Different factories may use different valid models. One may assign an operator to one machine. Another may measure hands-on labour across two machines. The models become misleading when their boundaries are mixed.
An operator may serve several machines. Check whether serving one delays another. Two machines may need manual work at the same moment. Their average labour minutes can hide this demand.
Use a simple event chart for a short trial. Mark when each machine needs intervention and when the operator is available. This reveals conflicts that a daily average can hide.
For the broader choice of cost pools and time bases, use ApparelDiary’s guide to turning cost per minute into a CM price. Keep the embroidery worksheet focused on how this specific decoration uses those resources.
Spread setup over the quantity that benefits
Setup may include artwork checks and digitising. It may also include thread loading, frame preparation, test sewing and first-piece approval. Some of it can be reused on a repeat order. Other parts return whenever the job runs.
Separate three groups:
Design development that creates or changes the embroidery file.
Order setup that prepares the current run.
Recurring cycle work that happens throughout production.
This prevents an apparent price reduction from hiding unpaid development. It also makes repeat-order pricing easier to explain.
Consider an example order. It needs 45 machine minutes at 0.30 currency units per minute. Digitising needs 60 minutes at 0.40 per minute. Proof materials cost 2.50.
Setup and development cost = (45 × 0.30) + (60 × 0.40) + 2.50 = 40.00.
Across 300 accepted placements, the allocation is about 0.133 each. Across 50, it becomes 0.80 each.
These figures show why small quantities can carry a higher unit cost. They do not prove that every setup item should be charged again on a repeat. Identify what remains usable and what must be repeated.
Include incomplete final cycles
A long order may nearly fill every cycle. A short order or size split may leave several heads idle near the end.
Suppose five heads can run at once. An order needs 23 placements. This example assumes no rejects.
Required cycles = round 23 ÷ 5 upward = 5 cycles.
The job uses 25 head positions across those cycles, but only 23 are filled. At 32 minutes per cycle, total machine occupancy is 160 minutes.
Dividing 32 minutes by five heads suggests 6.4 machine minutes per piece. Yet the actual order uses:
160 ÷ 23 = 6.96 occupied machine minutes per placement.
The difference comes from the partly filled last cycle. It is not a machine fault.
Production needs whole garments. Plan how to handle replacement pieces. An expected yield does not create fractional garments. A probability-based cost estimate and a whole-piece loading plan serve different purposes. Review both before confirming the delivery date.
Price stops and special operations from evidence
Colour count can matter, but it is not a complete measure of colour-change cost. The sequence, available needle positions and actual machine functions also affect the cycle.
Record manual thread changes separately from automatic needle selection. A six-colour design may use needles that are already loaded. Another job may need a specialty thread fitted during production. Their cycles can differ.
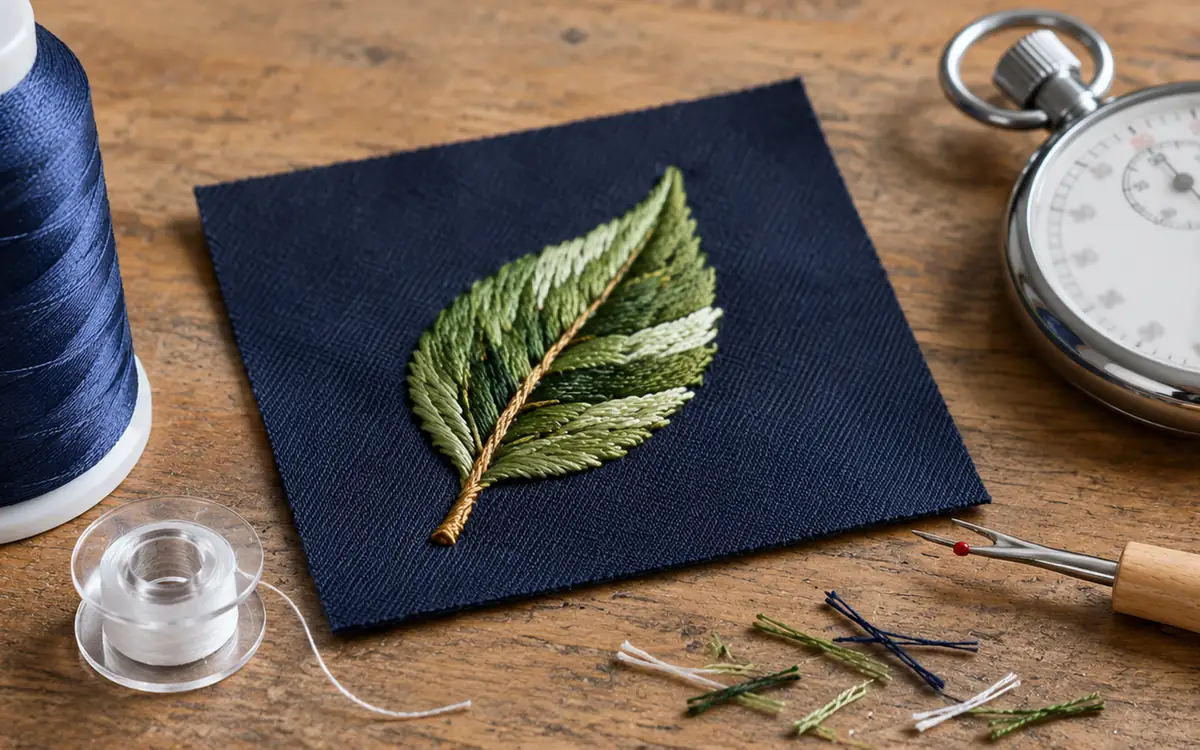
Appliqué needs particular care. Include material preparation, placement, securing and any trimming that the approved method requires. Observe whether these steps stop the whole machine or can happen off the machine.
The same logic applies to cords, sequins or other decoration methods. Do not copy a surcharge from an unrelated technique. Build a sample route, time its stages and record the skill or tooling it needs.
A slow but stable route can be cheaper than a fast route with frequent damage. Cost the approved quality level and compare routes at that level.
Keep material inputs traceable
Identify top thread and bobbin thread in the worksheet. Add backing, topping, appliqué material and other items used. Use the approved file and a suitable measured basis for consumption.
Do not assume all colours use equal quantities. A loaded cone may retain usable thread after the job. Do not charge the whole cone as consumed material if it serves later work.
State how small remnants and unusable leftovers are treated. A special colour purchased solely for a short order may create a genuine minimum purchase cost. That cost is different from thread consumed in the design.
Backing choice can also change time. Precut pieces may cost more to buy but reduce preparation. A different support may change trimming effort or reject risk.
Qualify the material combination before using its fastest observed time. Madeira’s hooping guidance explains the role of stable support and suitable hooping. Cost comparisons lose meaning if one method distorts the garment or requires repair.
Treat garment damage as a separate exposure
The financial effect of a failed embroidery depends on when it is found and what remains usable.
A small thread fault may be repairable. Needle damage, a wrongly placed design or permanent hoop marks may make the whole garment unacceptable. If decoration happens late in production, the affected item already contains other work and materials.
Record at least the number attempted, number accepted first time, number repaired and number scrapped. Record repair time separately unless it is already inside the cycle data.
Consider an example lot of 100 pieces. Suppose 94 pass first time. Four pass after repair, and two are scrapped. Final accepted yield is 98%, while first-pass yield is 94%. Those figures answer different questions.
Using 98% alone can hide the repair burden. Using 94% as though all six failures were scrap can overstate garment loss. Build the quote from the actual route and ownership terms.
Compare software runtime with a sewn sample
Software estimates can speed up quoting. This can help a factory with many enquiries. Their value depends on the machine settings and assumptions behind them.
Wilcom’s Runtime Analyst documentation describes estimates based on specified speed and other runtime parameters. Its Runtime tab guidance links estimates to the chosen machine.
Keep the estimate and observed time together. Use like boundaries. Predicted machine runtime excludes off-machine packing. Do not compare it directly with a timed result that includes that packing.
Predictions may stay low for a job family. If so, investigate the cause. Speed settings may be unrealistic. The model may omit a recurring stop. Garment handling may be more difficult than the sample suggested.
Update the relevant parameter. Avoid multiplying every future job by one unexplained factor. A correction for a narrow sleeve may not belong on flat panels.
Test the assumptions that move the quote
Before releasing a price, vary the inputs that are least certain. This shows where one more sample or a short production trial could prevent a costly mistake.
Using the earlier hypothetical model, keep the occupied-hour cost at 30 currency units. Change one input at a time.
Scenario | Cycle | Usable heads | Accepted proportion | Conversion cost per accepted placement |
|---|---|---|---|---|
Original assumption | 32 minutes | 5 | 96% | 3.33 |
Slower loading and running | 36 minutes | 5 | 96% | 3.75 |
A qualified six-head layout | 32 minutes | 6 | 96% | 2.78 |
Lower accepted yield | 32 minutes | 5 | 88% | 3.64 |
For the slower cycle, expected accepted output becomes 60 ÷ 36 × 5 × 0.96 = 8 per hour. The hourly cost divided by eight gives 3.75 per accepted placement. That is about 12.5% above the original unrounded conversion cost.
This comparison identifies useful questions. Can the garment exchange be shortened without losing placement accuracy? Can a different approved frame arrangement use the sixth head? What caused the yield loss, and can that cause be removed before bulk work?
The table does not authorise a faster setting or promise a sixth usable head. Each route still needs quality and access checks. Nor should the separate savings be added together without testing the combined route. A layout that uses more heads might take longer to load.
Repeat the exercise for setup when the order quantity is uncertain. A 40-unit setup spread over 60 accepted placements adds about 0.67 each. Over 300 it adds about 0.13. A buyer may request several small deliveries. Each may need a fresh setup. The larger total order then does not automatically give the lower setup allocation.
Record the likely cost range. State the assumption behind the quoted point. Add the evidence needed to narrow the range. This is more useful than adding an unexplained contingency to every line.
Build a quote that survives a change
The commercial document should show enough detail to make changes reviewable without exposing every internal rate.
State the approved artwork dimensions and number of placements. Add garment condition, order quantity and the agreed decoration method. State whether digitising, sampling, garment supply and delivery are included.
List the changes that trigger review. A larger design can alter stitch count and field size. A new location can alter loading. A new fabric can require different support or speed. A smaller quantity can spread setup over fewer pieces.
For repeat orders, retain a short costing record linked to the approved file. Record the actual cycle range, usable heads, quantity, material route and major losses. This makes the next estimate faster and more accurate.
Review the completed order
After production, compare estimated and actual totals before the details fade.
Locate the source of the cost change. It may be design work, machine time or loading. Materials, repairs or a customer change may also explain it. Assigning all differences to “efficiency” gives little help for the next order.
A review may show that the machine ran as expected. The garment may still have needed extra handling. Another may show that the order was split into many colour lots, which repeated setup.
Keep unusual events visible. One power interruption should not automatically become a permanent design surcharge. A recurring fault tied to the design should lead to corrective work or a revised route.
The purpose is to improve the estimating basis, not to force every actual result to match the quote.
Frequently asked questions
Can embroidery be quoted only by stitch count?
It can support an initial price table for familiar work. Check unfamiliar garments, special techniques and small quantities against actual setup and cycle requirements before making a firm commitment.
Should machine speed come from the catalogue?
Use the catalogue to understand capability. Use the approved job settings and measured cycle to estimate this order. Maximum speed is not the same as sustained production speed.
Is a partly empty machine always a planning mistake?
No. A short order, garment spacing or a final balance may limit head occupancy. The quote should reflect that constraint instead of dividing cost by heads that cannot contribute.
Does a larger order always reduce the cost per piece?
It often spreads setup over more pieces. Other limits can offset that benefit. Extra shifts, difficult size mixes or repeated lot changes may alter the route. Check the actual plan.
Should repairs be included in yield or time?
They can affect both, but count each cost once. Track first-pass acceptance, final acceptance and repair minutes separately, then apply a consistent cost boundary.
Make the quote explain the work
A sound quote starts with the approved embroidery design. Link it to a realistic machine cycle and a clear quantity basis. Stitch count remains useful, but head occupancy, setup, handling and accepted output give it context.
The strongest worksheet is one that another person can check. It shows the source of each time and material input. It identifies open assumptions. It also shows what must change when the order changes. That makes pricing more reliable and gives production a workable commitment.
References
Wilcom: Embroidery pricing factors
Wilcom: Generate estimates from artwork
Wilcom: Runtime tab and machine-specific estimates
Tajima: TLMX machine specifications

Discussion0
Loading the discussion…