

A demand forecast can have zero average bias while missing every period by twenty units. Another can have a lower average absolute error but consistently leave the business short. Forecast accuracy needs more than one score, especially when apparel or trims demand includes zero-sales periods, changing volume and stockouts.
For a practical review, keep three questions separate: how large are the errors in units, how large are they relative to the evaluated demand, and which direction do they favour? Mean absolute error (MAE), weighted absolute percentage error (WAPE) and signed bias answer those questions. None proves that a forecasting method will work on the next style or season.
Freeze the forecast that the decision actually used
Save the forecast version before the period begins, together with its creation time, target period, item, location and horizon. A forecast revised after sales become known cannot fairly be evaluated as the original planning forecast. Likewise, comparing one method at a one-week horizon with another at a four-week horizon gives them different information.
Decide whether the actual represents orders, shipments, unconstrained demand or observed sales. They are not interchangeable. A stockout can suppress sales below demand, while a shipment may occur later than the customer's original need. Keep returns and cancellations under an explicit rule rather than allowing negative net quantities to enter a percentage denominator unnoticed.
The forecast evaluation chapter in Forecasting Principles and Practice distinguishes genuine forecast errors from training residuals. Use a held-out period or rolling forecasting origins that respect time order. Do not randomly shuffle future weeks into model training and then call the result a forward planning test.
Define the error sign before reporting bias
This article uses error equal to forecast minus actual. A positive signed error means overforecasting; a negative error means underforecasting. Other references and software use actual minus forecast, so the sign must be stated beside the metric. Absolute error measures are unchanged by that sign choice.
For n evaluated observations, mean absolute error is the sum of absolute errors divided by n. Its unit is the same as the actual: pieces, metres or kilograms. It is useful for understanding an operational miss, but a 20-piece error has a different significance for a 30-piece item than for a 3,000-piece item.
For nonnegative actual demand with a positive total, weighted absolute percentage error, usually called WAPE, is the sum of absolute errors divided by total actual demand, multiplied by 100. The weighting comes from the aggregate denominator; it is not the simple average of each row's percentage error.
Signed bias percent in this worksheet is the sum of forecast minus actual, divided by the same positive actual total, multiplied by 100. Keep the mean signed error in units available as well. Bias shows direction, while absolute error shows size; cancellation makes them different measures.
Work through one common evaluation window
The following illustrative dataset uses four periods for the same demand series. Both forecasts were assumed frozen at an equivalent horizon. The zero in period two is treated as a genuine zero-demand observation for this example, rather than a missing record or a stockout.
Period | Actual units | Forecast A | Error A units | Forecast B | Error B units |
|---|---|---|---|---|---|
1 | 100 | 80 | −20 | 90 | −10 |
2 | 0 | 20 | 20 | 0 | 0 |
3 | 50 | 70 | 20 | 40 | −10 |
4 | 150 | 130 | −20 | 100 | −50 |
Total | 300 | 300 | 0 | 230 | −70 |
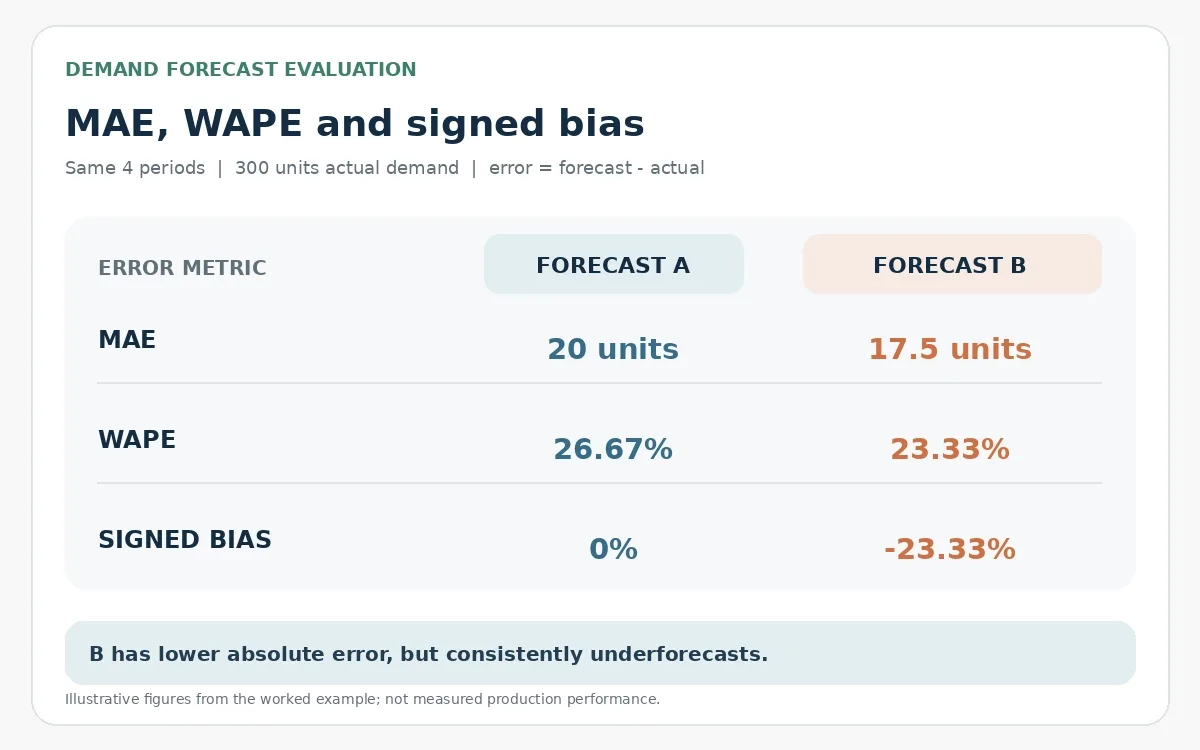
Forecast A has 80 units of absolute error. Its MAE is 80 ÷ 4 = 20 units, WAPE is 80 ÷ 300 × 100 = 26.67 percent, and signed bias is zero. The errors cancel in the signed total even though no period is exactly right.
Forecast B has 70 units of absolute error. Its MAE is 17.5 units, WAPE is 23.33 percent, mean signed error is −17.5 units, and signed bias is −23.33 percent. It has the lower absolute error score in this small window but a clear underforecasting direction under the chosen convention.
That does not make B automatically preferable. The cost of shortages, excess stock and timing matters. Nor does it justify adding 17.5 units to every future prediction after seeing only four observations. Investigate the pattern on enough relevant, genuinely future evaluations before changing the forecasting process.
Handle zeros without changing the meaning of the test
Mean absolute percentage error divides each error by that period's actual. A zero actual therefore makes that row's ordinary percentage error undefined. Removing every zero-demand period produces a different evaluation sample, often excluding exactly the intermittent-demand behaviour the planner needs to understand.
WAPE can remain defined when some actuals are zero, as it does here because total actual demand is 300. Rob Hyndman's discussion of WAPE also explains its limitations. If all actuals are zero, its denominator is zero; report the metric as undefined and retain the absolute errors in units. Do not replace the result with zero percent error or an arbitrary perfect-accuracy label.
WAPE is not a universal answer for trends, seasonality or changing evaluation volumes. Comparing percentages across differently composed windows can change the apparent score without a comparable improvement in the underlying forecast. Retain a suitable benchmark and consider scaled measures where the evaluation question calls for them. A metric should serve a defined comparison rather than become a convenient league table.
Compare models on the same items and information
Use the same periods, items, locations, horizon and actual-data version for every candidate. A method evaluated only on easy high-volume items should not be ranked against another evaluated on the complete assortment. Show coverage and missing forecasts as explicit outcomes, with the agreed handling rule.
Keep a simple benchmark, such as an appropriate naive or seasonal-naive method, generated at the same forecast origin. A complex model that fails to improve on that relevant benchmark needs investigation before deployment. Evaluate horizons separately when procurement and short-term scheduling make different decisions from the same demand series.
The site's exponential smoothing guide introduces model choices. This evaluation record is the companion discipline: compare their predictions on unseen periods instead of choosing whichever produces the smoothest historical chart.
When using a software report, check whether it was passed test observations or only a fitted model. The forecast package accuracy documentation explicitly distinguishes training and test measures. The label accuracy on a software output is not enough to identify which information was used.
Build a review sheet with an action attached
Retain the row-level forecast, actual and signed error. Calculate absolute error from that same row so an analyst can reconcile every summary back to the input. Record exclusions with reasons and preserve the original data rather than overwriting a missed forecast with a later revision.
Review field | What to record | What it prevents |
|---|---|---|
Forecast identity | Version, origin and horizon | Using hindsight |
Actual basis | Orders, demand or sales and data version | Mixing different outcomes |
Evaluation scope | Item location period and coverage | Selecting only convenient rows |
Absolute performance | MAE and absolute-error total | Hiding misses through cancellation |
Direction | Signed bias and stated sign convention | Misreading overforecasting as shortage |
Context | Stockouts, promotions and assortment changes | Treating changed conditions as model evidence |
Response | Owner, investigation and next review | Reporting a score without a decision |
The site's factory dashboard guide explains the importance of a defined owner and decision. For this review, the owner should distinguish a data problem, an unusual event, a systematic forecasting problem and an inventory-policy issue before prescribing a response.
Keep planner overrides as a separate forecast version
If a planner changes the model forecast for a known promotion or customer commitment, retain both the original model output and the final released plan. Record the reason and the information available at that time. Evaluate the two versions over the same later observations to learn whether the override helped under comparable conditions.
Do not replace the original forecast with the override and then attribute the final score entirely to the model. Equally, an override that was commercially necessary may address a different objective from minimising statistical error. The review should preserve that decision context and examine repeated patterns, rather than declaring every individual adjustment good or bad from one realised outcome.
Keep the business interpretation visible
A portfolio WAPE is a ratio of totals, not an unweighted average of item WAPEs. High-volume items contribute more to the portfolio numerator and denominator. If a small critical item matters commercially, inspect it separately rather than assuming its low volume makes its missed demand unimportant.
Do not label 100 minus WAPE as a universally meaningful accuracy percentage. WAPE can exceed 100 percent, and a convenient display limit can conceal how poor a forecast was. Also keep forecast error separate from safety stock: a biased forecast and a variability buffer require different corrective decisions.
Anchor the next forecast review to an archived version and a fixed evaluation window. Put the actual-data reconciliation, unit errors, absolute performance, signed bias and relevant benchmark on the same review sheet. Assign the investigation to the pattern that matters commercially, keeping the underlying periods and denominator available for checking.


Discussion0
Loading the discussion…