
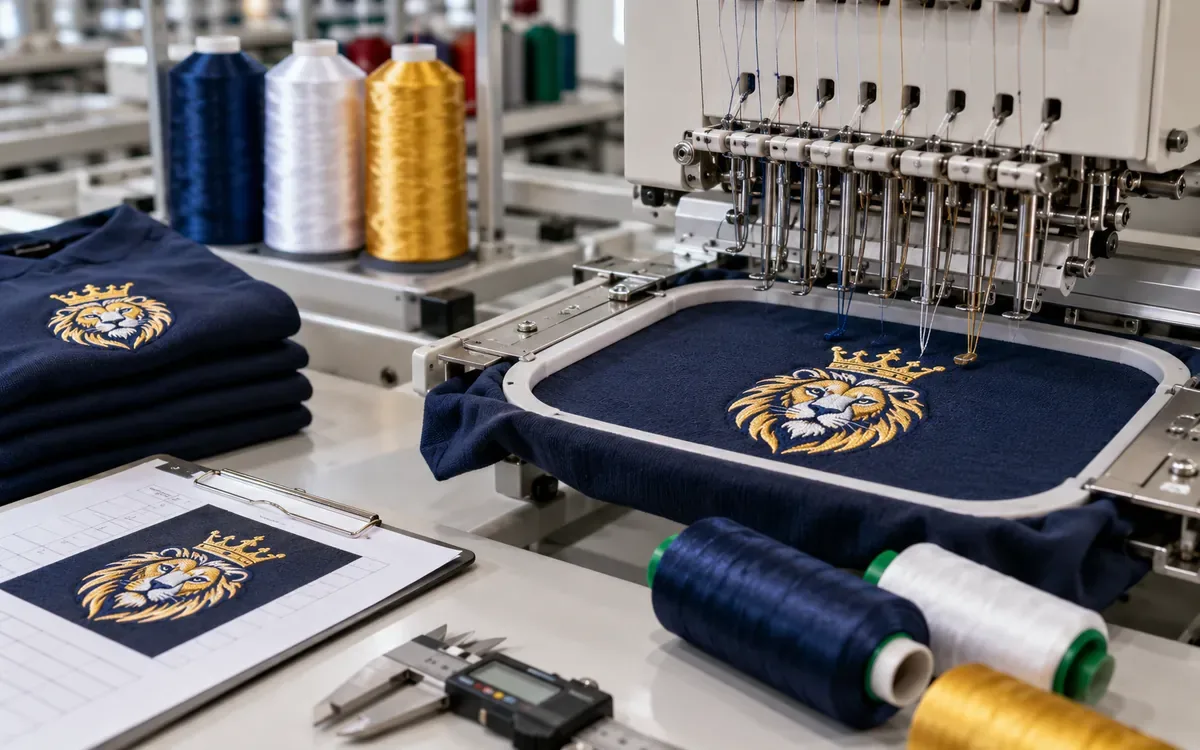
Embroidery thread consumption starts with the approved design, not a fixed number of metres per logo. Stitch length, stitch type and fabric thickness can change the amount used. Colour sequence and trimming matter too. The top thread and bobbin thread also need separate estimates.
A useful calculation connects the stitch file with a measured sew-out. It then scales that result to the actual design versions and quantities. The aim is to predict how much thread the job will use. Keep machine loading and purchase packaging clear too.
All numbers below are made up for teaching. They are not standard use rates for a machine, thread or garment.
Define the unit being estimated
State what the estimate covers. Is it one motif, one placement, one garment or one run? A garment with a chest logo and two sleeve motifs contains three placements. Multiplying only the chest design by the garment quantity would miss the others.
Name the exact file revision and finished dimensions. A file called “brand logo” may exist in several sizes and stitch versions. Its preview image cannot establish its consumption.
List every top-thread product and colour. Record the bobbin specification separately. A colour may appear several times in the stitch sequence. It may still use the same stock code each time.
Decide what the result means. Does it measure thread left in the embroidery or all thread used during production? These are different boundaries. Trims and start tails use thread. So do repairs after thread breaks and rejected sew-outs. That thread does not remain in an accepted garment.
A clear estimate could state: “Top and bobbin use per accepted 80 mm chest motif. File revision C, on the approved knit and backing. Initial development samples excluded.” This scope prevents several later calculation errors.
Understand why stitch count alone is incomplete
Two files may each contain 8,000 stitches. They can still use different thread lengths. One may contain many short running stitches. Another may include longer satin stitches and a different underlay.
Consider a simple flat-path example. The first file’s mean distance between stitch points is 1.8 mm:
8,000 × 1.8 ÷ 1,000 = 14.4 m.
If the second file’s mean distance is 3.6 mm, its corresponding total is 28.8 m. The same stitch count produces twice the flat path length in this example.
These totals are not complete top-thread consumption. They leave out the path through the material. They also omit stitch formation below it. Check which movements the file counts as stitches. It may record other movements as jumps or trims.
The lesson is to preserve the design information behind a rate. A rate may say “five metres per thousand stitches.” It can help with an early check for a known class of work. It should not replace a validated design estimate.
Madeira’s FAQ gives an approximate benchmark tied to standard thread and a stated stitch length. Its top and bobbin figures are rules of thumb. Check the conditions attached to that benchmark. It is not a fixed relationship for every job.
Read the software report correctly
Obtain the available technical report from the approved working file. Check design dimensions, total stitches and colour sequence. Add the target fabric and estimated top and bobbin lengths.
Wilcom’s stitching-tab documentation distinguishes total top-thread metres from bobbin metres. It also separates design area from thread length. These fields answer different planning questions.
The design may have been resized or redigitized. If so, its earlier report is no longer the right basis. Regenerate it after the final technical changes. Keep its identity with the exported machine file.
Where the software supports colour-level estimates, retain them. It may give only a total. Do not divide that total by each colour’s share of visible artwork. A narrow outline can use a different stitch structure from a large fill.
Review how the software handles fabric thickness and bobbin assumptions. Wilcom’s thread-estimate guidance permits adjustments for the target material and stitch mix. Its illustrative settings are not substitutes for measurement.
Record units explicitly. A report may use yards while a cone label uses metres. Convert them before comparison. Check what the displayed total covers. It may be one design or a group with several copies.
Keep top and bobbin identities separate
The visible colour sequence usually drives top-thread planning. Bobbin planning follows the actual machine and embroidery construction. Do not assume the two use equal lengths or interchangeable thread products.
Brother’s thread guidance lists different bobbin recommendations for specified machine families. This is one reason to name the thread for the actual machine. Keep that identity in the worksheet.
Record product, size designation, colour and package type. A list may say only “white bobbin thread.” That can hide differences that affect running and stitch balance. Confirm the approved specification before measuring consumption.
Check the stock code for repeated top-thread blocks. Combine them only if the approved code matches. Rayon, polyester and a specialty thread may share a colour name. That does not make the products equivalent.
Madeira’s ordering guidance distinguishes product and package item codes from colour codes. Use both where the supplier’s system requires them.
The total top-thread estimate helps compare designs. The colour-level quantities tell stores which products are needed. A job may have ample top thread but too little bobbin thread. The separate bobbin estimate helps prevent that shortage.
Measure a representative sew-out
Use the approved garment material, backing, thread and machine setup. Record the actual file dimensions and the number of completed motifs. Firm test cloth may sew well. That result may not represent the intended stretch garment.
Choose a method that suits the equipment. It must also give the accuracy the decision needs. Thread can be removed from a small test element. Measuring it can help explain a local path. Dense multicolour embroidery may be difficult to dismantle without losing pieces.
Coats’ thread-consumption guide describes actual measurement as an alternative to estimated ratios. Its garment-seam ratios should not be transferred directly to an embroidery motif.
A checked mass or length method can track a batch. This can help measure a production-style run. Keep the starting and ending thread boundaries consistent. Account for thread between the package and needle. Include thread in partly used bobbins. Use the same basis at the start and end.
Avoid adding an unqualified measuring device to the thread path. It could alter feed or tension and change the process being measured. Any instrument in the process must suit the machine. Show that it does not disturb the result.
Measure enough identical sew-outs to produce a useful change. It must be large enough for the instrument to measure. One small logo may use very little mass. Its measured change may not support all the decimals shown in a spreadsheet.
Use a batch-mass example with a checked conversion
A mass-based estimate needs the actual thread mass per length. Measure it under comparable conditions. A trade size label alone is not that measurement.
Suppose the exact thread lot is checked by a suitable method. A measured 100 m length weighs 2.00 g. The illustrative mass per metre is:
2.00 ÷ 100 = 0.0200 g/m.
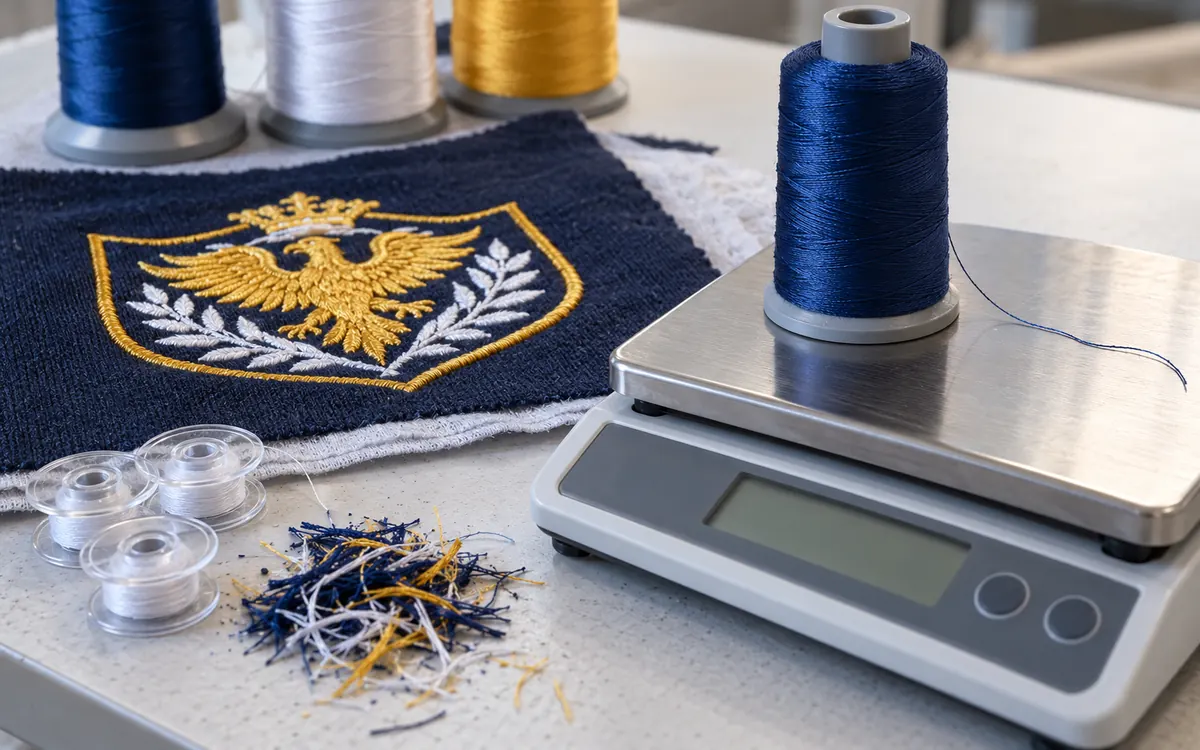
A controlled batch contains 40 identical motifs. It reduces the top-thread package mass by 18.4 g. The same package holder remains present in both weighings. Thread outside the package is handled on the same start-and-end basis.
Estimated batch length = 18.4 ÷ 0.0200 = 920 m.
Estimated use per motif = 920 ÷ 40 = 23.0 m.
This represents the thread removed from that package within the measured boundary. The batch may include ordinary trims and tails. If so, the measured use already includes them. Adding another allowance for the same tails would double count them.
Check that weighings repeat reliably. Keep moisture state and package handling consistent. Check the measured mass-per-length conversion too. A changing holder or label can distort the package difference. A very small difference may be unsuitable for the balance being used.
Repeat the measurement on another controlled batch. Report sensible precision based on the method. The arithmetic may produce many decimals. The physical measurement may not justify them.
Calibrate the estimate by colour where it matters
Consider an example motif with three colours. The approved software report and controlled production measurements give the following top-thread results:
Stock colour | Software estimate per motif | Measured use per motif | Measured-to-estimated factor |
|---|---|---|---|
Navy | 18.0 m | 19.8 m | 1.10 |
White | 6.0 m | 6.3 m | 1.05 |
Gold | 2.0 m | 2.2 m | 1.10 |
Total | 26.0 m | 28.3 m | About 1.088 |
For navy, 19.8 ÷ 18.0 = 1.10. The total ratio is 28.3 ÷ 26.0, or about 1.088. That total may be useful for a quick design-level comparison.
Applying the total ratio to every colour would slightly change their individual estimates. A colour may be costly or come in small packages. It may serve many jobs. A separate measured factor for that colour gives more useful detail.
The factors belong to the tested file, stack and measurement boundary. They are not permanent properties of navy, white or gold thread. A changed stitch structure or trim sequence can change the relationship.
Keep the raw measurements behind the factors. If one batch contains repairs or rejected sew-outs, record them separately. A correction factor should not silently absorb an unrelated process failure.
Check whether the software already includes a stated allowance. The estimate may already include an allowance. It can still be compared with gross measured use. Make that basis clear.
Measure bobbin use on its own boundary
Track bobbin thread separately from the top colours. Record usable bobbin quantities at the start and end. Include partial bobbins. Counting empty bobbins may miss thread that remains elsewhere. Check returned and changed packages too.
Suppose a controlled batch has 40 motifs. After the stock checks, estimated bobbin use is 468 m. The batch rate is 468 ÷ 40 = 11.7 m per motif.
If the software estimate is 10.8 m, the measured-to-estimated ratio is 11.7 ÷ 10.8, or about 1.083. The two factors happen to be close in this example. That is not a reason to use the top-thread factor for bobbins.
Keep the bobbin product unchanged during comparison. A different size or construction may require a setup change. That can affect the sewn result as well as consumption.
Record why bobbins were changed. A bobbin may run empty. It may be changed for colour or removed after damage. These events leave different amounts of thread. Treat usable remnants as stock where the approved process permits their reuse.
The purpose is a measured production requirement. It does not mean that all thread wound onto a bobbin enters an accepted motif. Some thread may remain or leave as waste.
Separate recurring use from one-time setup
An embroidery run can consume thread before its first saleable garment. Design checks, machine setup and shade trials may be fixed uses for that run. Keep them separate when they are material.
Suppose the measured recurring navy use is 19.8 m per motif. A run of 2,400 motifs needs:
2,400 × 19.8 = 47,520 m.
If the approved setup plan adds 180 m of navy thread, the combined requirement is 47,700 m before any separately defined reserve.
The 180 m adds 0.075 m per motif on this run. On a 240-motif run it adds 0.75 m per motif. A fixed setup amount is shared among fewer pieces on a short run. Its effect per motif is therefore larger.
Check whether development samples will be needed again. Do not add them to every repeat order by default. Separate first-time digitizing trials, production setup and normal running use.
Check what the measured rate includes. Do this before adding a general waste percentage. The 19.8 m figure may already include ordinary trimming and small normal running losses. Name the uncertainty or loss covered by any extra reserve. It must remain outside the measured rate.
Build the order from design versions and placements
An order may use several motif sizes. Estimate each approved version separately when its stitch file changes. A graphic may grow by a stated proportion. Its thread use need not grow by the same proportion.
In an example order, 1,200 garments carry a small chest motif. Each motif uses 18 m of top thread. Another 800 carry a larger version using 29 m. A separate sleeve motif uses 7 m and appears twice on every garment.
Chest requirement = 1,200 × 18 + 800 × 29 = 44,800 m.
Sleeve requirement = 2,000 × 2 × 7 = 28,000 m.
Total top thread across the stated designs = 72,800 m.
This total is useful for checking completeness. The total does not yet show what to buy. Split it by compatible stock code first.
Keep optional placements visible. If only part of the order receives a second logo, give that group its own quantity. Do not use an average placement count that hides which garments receive which decoration.
Check personalisation separately. A long name and a short name can use different amounts. The colour sequence may change too. Use the actual data where available. Otherwise, state the mix assumed for planning. Check it before release.
Account for repeated colour blocks
A file may use navy, then white, then navy again. This gives three sequence blocks. It uses only two top-thread stock codes if the navy specification stays the same.
Sum the navy lengths across its blocks for material planning. Keep the block sequence for machine time and trimming review. Three colour changes do not mean three different products. Order from the stock codes, not the change count.
Trims also need careful counting. A trim event can leave tails whose lengths depend on the actual setup. A software event count is not itself a measured length of waste.
For a diagnostic example, a design revision removes 20 unnecessary trim events. Suppose a controlled test measures the change in this setup. Each removed event saves 0.03 m of total top thread. The estimated change is 20 × 0.03 = 0.60 m per motif.
That value is only an illustrative measured relationship. Verify the revised design’s security and appearance. Removing trims solely to save thread may create visible travel stitches or another product fault.
Recalculate consumption after the final approved edit. The design’s material and time records should describe the same revision.
Distinguish thread consumed from packages needed at the machine
A multihead machine needs suitable thread packages at the active positions. A short run may need several packages. One large cone may hold enough total metres, but it cannot feed every position at once.
For example, six active heads each need navy thread during the same cycle. The plan must provide six compatible feed packages or an approved alternative arrangement. The unused length afterward remains stock if it is usable and identified.
This loading requirement should not be added as if all six packages are fully consumed. Keep package availability and expected use as separate quantities.
The same distinction applies to bobbins. The plan needs enough compatible bobbins for the change routine. Consumption measures the thread actually used. The two constraints can drive different preparation decisions.
ApparelDiary’s sewing-thread consumption and cone-order guide explains the general stock and packaging arithmetic. Use the embroidery measurements here as inputs to that guide. The general cone-order method does not need to be repeated.
Check the arithmetic before purchasing
A fractional cone is an estimate of length expressed in package units. It is not a physical order quantity.
Suppose a design needs 0.001 of a stated cone per garment. For 10,000 garments:
0.001 × 10,000 = 10 cones of equivalent length.
It does not equal 100. The result still needs colour separation, usable stock and actual package requirements before purchase.
Check the implied metres as a second route. Suppose the example cone holds 5,000 m. Then 0.001 cone equals 5 m. Ten thousand garments need 50,000 m, which is ten such cones. Both routes give the same length.
Avoid mixing a thousand-stitch rate with a single-stitch count. At an illustrative 5 m per 1,000 stitches, 8,000 stitches gives 40 m, not 40,000 m. Keep the denominator beside the rate.
A small dimensional check beside the formula often catches a large purchasing error. Every worksheet should preserve the unit of the input and result.
Review changes that invalidate the old estimate
Thread consumption should be revised when the approved design or production stack changes. Scaling and lettering edits can change the result. Added underlay, altered density and changed stitch directions can affect it too.
Madeira’s density guidance notes that thread sizes can need different digitizing. Needle choices may also need to change. A finer thread may require changes to the process. Changing one product code in the purchase sheet may not be enough.
A new backing or thicker garment can also change the sewing conditions used by the estimate. Review whether the software assumptions and measured calibration still apply.
Treat a revised file as a new comparison. Keep a link to the earlier file. Record the reason for the change and the measured effect. This builds evidence for later estimates. It does not mean that every logo uses the same factor.
Keep technical approval ahead of cost claims. A revision may save two metres but give poor coverage. It is not an equivalent design that simply uses less thread. The product result must remain acceptable.
Reconcile a production run without hiding rejects
Choose a defined run and retain its actual motif count. Distinguish attempted motifs, accepted motifs, rejected pieces and repairs. A material rate per attempt differs from one per accepted garment.
Suppose an example run attempts 1,000 motifs. It uses 30,000 m of top thread. Of these, 960 are accepted without further work. Consumption per attempt is 30 m. Consumption per accepted motif is 30,000 ÷ 960 = 31.25 m.
Neither number is wrong. They answer different questions. The first describes the attempt boundary; the second allocates the run’s thread to its accepted output under the stated assumptions.
Compare the run with the estimate on the same basis. The plan may use accepted output while the actual report uses attempts. An apparent saving may then be misleading.
Investigate large differences by file version, colour, thread breaks, repairs and stock records. Do not immediately increase every allowance. A missing return or an unrecorded setup batch can look like excessive design consumption.
Use the findings to improve the next estimate. Keep abnormal incidents visible rather than turning one unusual run into a permanent standard.
Questions about embroidery thread estimates
Can I estimate a logo before it has been digitized?
A rough estimate may support an early quote. State its assumptions clearly. Confirm the required amount after digitizing. Use the final stitch file and a representative sew-out. Artwork area alone cannot reveal the complete thread path.
Is bobbin thread always a fixed percentage of top thread?
No. Stitch structure, material and setup affect their relationship. Software may provide an estimate. A relevant measured check gives a stronger basis for the production plan.
Can one measured factor cover every size of a logo?
Only if evidence supports that use. Resizing may regenerate stitches, change small details or alter density. Review each production file and measure where the resulting uncertainty matters.
Should trim waste always be added after measurement?
Only when the measurement excludes it. A batch measurement of package depletion may already include trims and tails. Define the boundary before applying another allowance.
Why does a short job leave so much thread unused?
Several heads or colours may need separate packages even when total consumption is small. That is a machine-loading requirement. Identified usable remnants can remain available for later work.
Base the estimate on the design that will run
A reliable estimate starts with a traceable stitch file. Add a suitable measurement of thread use. Keep top and bobbin use separate. Preserve colour identity. Separate recurring use from setup.
A reviewer should be able to trace each worksheet quantity. It should link to a design version, placement count and measured basis. This makes the estimate useful for purchasing and production. It helps keep calculation errors and unsupported rules of thumb out of the order.
References
Madeira: Embroidery thread consumption questions
Wilcom: Stitching information and separate thread estimates
Wilcom: Adjusting thread usage estimates
Brother: Thread requirements for specified embroidery machines
Madeira USA: Product, package and colour identification

Discussion0
Loading the discussion…