
Follow the water, the web and the finished fabric
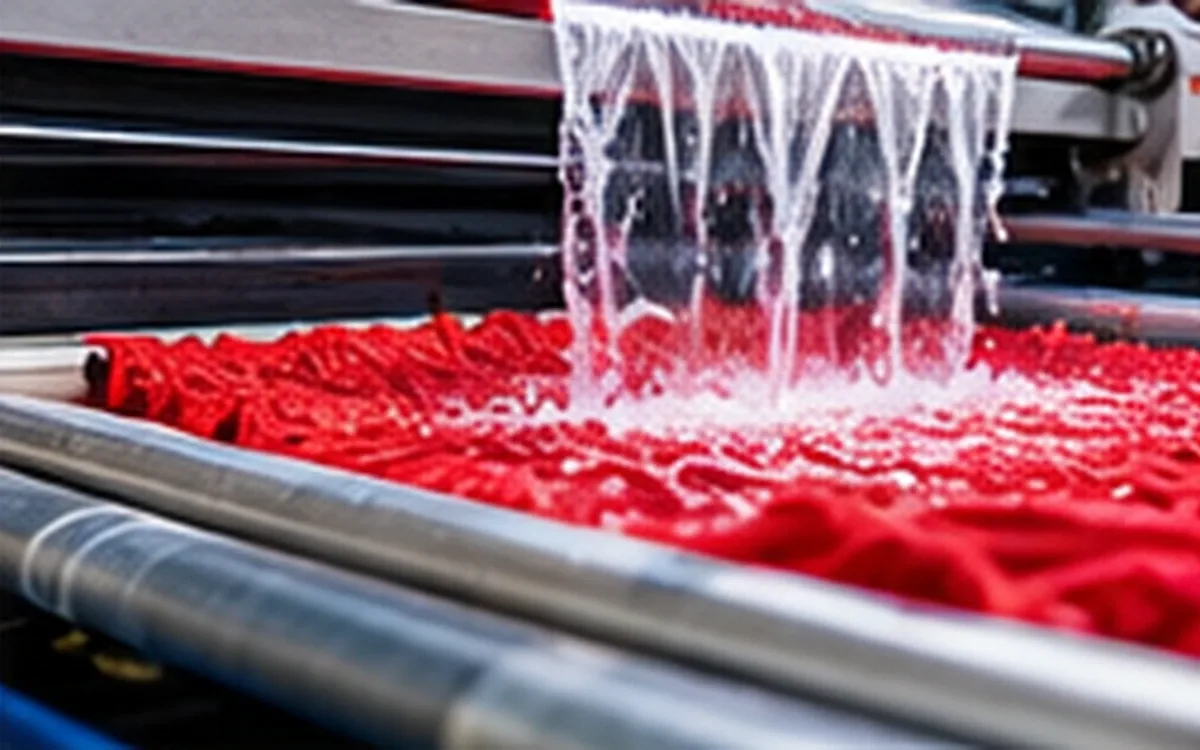
Hydroentanglement bonds a fibre web with fine water jets. The process is also called spunlacing. A useful review follows the web entering the jets and the water reaching each jet strip. It connects both to the fabric that leaves the line. A pressure reading alone cannot explain the result.
The task is to produce the required fabric at a stable rate. That means checking strength, surface, mass and other agreed properties alongside resource use. A change that raises strip strength may still harm another property. A lower energy figure can also reflect a change in the calculation rather than a better process.
This guide builds an original example around two jet heads. All operating values, capacities and trial conditions in the example are fictional. They illustrate calculations and decisions; they are not a machine recipe. Actual settings must remain within the equipment limits and the approved product process.
Understand what the bonding step does
EDANA describes hydroentanglement as mechanical bonding with fine, high-pressure water jets. The jets rearrange fibres so that they become entangled. Carding and wet laying are among the routes used to form the incoming web. Web formation and bonding are separate stages, even when they operate on one continuous line.
This distinction matters when someone asks why two spunlace fabrics behave differently. Their fibres, web structure and later finishing may differ. The word spunlace identifies a bonding route. It does not specify every feature of the finished material.
Keep the product description specific. State fibre composition, target mass per unit area, surface design and intended use. Identify any other bonding or finishing steps. Water-jet bonding alone does not prove that a finished product has no added chemicals. Later finishing can include further treatments. Nor does the process name alone prove suitability for skin contact, filtration or another demanding use.
Start a trial with a written question. For example, a proposed speed increase needs to preserve cross-direction breaking force. Ask whether it also preserves the agreed surface quality. That question gives the team a clear response to measure. Asking whether a sample feels better leaves too much room for competing interpretations.
Check the incoming web before changing pressure
An uneven web gives the bonding section an uneven task. Record the fibre lot, blend, forming route and incoming mass profile. Keep the machine direction, or MD, and cross direction, or CD, clear on every sample. EDANA notes that the orientation created during carding affects directional properties. A web with a strong MD bias should not be treated as though its structure were equal in every direction.
Map the samples to positions across the width and along the trial. A low average mass and a narrow low-mass band are different problems. The first affects the whole output basis. A roll average may hide the narrow band, though it still matters to a converter.
Use a consistent mass basis when comparing the incoming web with the finished fabric. Moisture, later additions, trim and fibre loss can change the result. Record these separately where they matter. Two unmatched samples may differ for other reasons. Their difference does not prove that the jets removed fibre.
ApparelDiary's fabric GSM testing guide explains how area and specimen mass define the result. In a hydroentanglement trial, add the sample location and process stage. Those details link the laboratory result to the line condition that produced it.
Treat the support surface as a process variable
The web needs support while water passes through it. The geometry of that support affects the structure formed during treatment. It deserves a controlled identity, just like the jet strip or fibre lot.
Seyam, Shiffler and Zheng's research examined forming wires, fibres, pressures and repeated passes. Their work linked the support geometry to the fabric's cellular structure. The tested routes could have equal specific energy yet give different tensile results. The authors noted limits in their study: low operating speed and the transfer conditions.
When comparing recipes, record the support and how the web moves between stages. Do not assume a pressure setting transfers unchanged to another screen. A different support can alter the trial even if the total water flow remains the same.
Keep surface appearance and strength as separate responses. A clearly defined pattern does not prove that every strength requirement passes. Likewise, a good strip result does not establish that the approved surface has survived. ANDRITZ's spunlace brochure describes dedicated patterning and aperture sleeves. That capability reinforces the need to identify the actual surface used in each trial.
Calculate jet hydraulic power from matching readings
For steady flow, pressure work per unit volume gives a useful hydraulic-power calculation:
Hydraulic power in watts = pressure difference in pascals × flow in cubic metres per second.
The pressure difference and flow must describe the same boundary. For a jet estimate, use the pressure drop across that jet head and the flow through its active nozzles. A pump discharge gauge farther upstream may include losses outside this boundary.
KSB defines pump power output as power transferred to the fluid. Its equation uses density, gravity, flow and head. With pressure difference equal to density × gravity × head, the pressure-flow form follows. It is hydraulic power, not the electrical input to the motor.
For bar and litres per minute, the conversion becomes:
Jet hydraulic power, kW = pressure drop, bar × flow, L/min ÷ 600.
One bar is 100,000 Pa. One litre per minute is 1 ÷ 60,000 m³/s. Combining those conversions and changing watts to kilowatts gives the divisor 600. Using litres per hour in that equation without changing the divisor would give the wrong answer.
In the fictional case, the measured pressure drops and flows are steady. All flow in the table passes through the active nozzles. The stated figures contain no uncounted bypass.
Jet head | Pressure drop, bar | Nozzle flow, L/min | Hydraulic power, kW |
|---|---|---|---|
A | 80 | 120 | 16 |
B | 120 | 150 | 30 |
Total | Not additive | 270 | 46 |
Head A supplies 80 × 120 ÷ 600 = 16 kW. Head B supplies 120 × 150 ÷ 600 = 30 kW. The combined estimate is 46 kW. Each head has its own flow path. Adding their pressure readings would not describe a third operating pressure.
Put energy on a stated dry-mass basis
Power describes a rate of energy transfer. Specific energy expresses that energy against a quantity of output. For steady production, dividing kilowatts by kilograms per hour gives kilowatt-hours per kilogram.
Assume the full treated web is 2.0 m wide, travels at 30 m/min and has a dry mass of 60 g/m². These values describe the same stage in the example. Width and dry mass do not change through the calculation boundary.
Area rate = 2.0 × 30 = 60 m²/min = 3,600 m²/h.
Dry-mass rate = 3,600 × 60 ÷ 1,000 = 216 kg/h.
Jet hydraulic specific energy = 46 ÷ 216 = 0.213 kWh/kg, rounded.
Since 1 kWh equals 3.6 MJ, the same result is about 0.767 MJ/kg. The unrounded value is used before conversion. The area rate is also 1 m²/s, so 46 kW corresponds to 46 kJ/m² at this condition.
These values describe the hydraulic input assigned to the treated web. They do not measure the fraction that becomes useful fibre rearrangement. Nor are they the line's electricity bill. Keep the boundary in the name of the metric so that a later report does not silently broaden its meaning.
The denominator also matters. The 216 kg/h figure includes the full treated width. If edge trim or rejected output is later removed, saleable dry output will be lower. Calculate cost per saleable kilogram from that lower accepted output. Include the costs incurred to produce it.
Test what happens when speed or mass changes
Now change one condition at a time while holding the two jet-head readings fixed. The resulting arithmetic is straightforward, but the fabric response still needs a trial.
Scenario | Speed, m/min | Dry mass, g/m² | Dry output, kg/h | Jet energy, kWh/kg |
|---|---|---|---|---|
Starting condition | 30 | 60 | 216 | 0.213 |
Higher speed | 45 | 60 | 324 | 0.142 |
Heavier web | 30 | 80 | 288 | 0.160 |
At 45 m/min, dry output is 2 × 45 × 60 × 60 ÷ 1,000 = 324 kg/h. The same 46 kW gives 0.142 kWh/kg, or about 0.511 MJ/kg. Energy per kilogram is one-third lower because one-and-a-half times as much dry mass passes through each hour.
The heavier web gives 288 kg/h and about 0.575 MJ/kg. Its specific energy is 25% below the starting condition. That does not make it a more efficient version of the same product: the product mass has changed.
Neither calculation predicts an exact loss of strength. It shows which exposure measure changed and by how much. Compare the finished properties and saleable output before judging the proposal. A higher speed that creates more rejected material may increase the cost of each accepted roll.
Separate pumping electricity from total line energy
Suppose a meter measures the relevant pump sets together at 64 kW in the starting condition. This is another fictional reading. It is taken over the same stable period as the jet measurements.
Pump-set electricity per treated dry kilogram = 64 ÷ 216 = 0.296 kWh/kg.
The ratio of estimated jet hydraulic power to this electrical input is 46 ÷ 64 = 71.875%. This is an overall ratio between the two stated boundaries. It includes whatever losses lie between the electrical meter and the jet measurement points. It must not be relabelled as the efficiency of the pump alone.
KSB's efficiency guidance distinguishes pump efficiency from pump-set efficiency. It also defines where the input is measured. Use the same discipline when comparing supplier data with site measurements. A shaft-power figure and an electrical-meter figure are different inputs.
The 0.296 kWh/kg calculation excludes other line users. Account for dewatering, drying, water treatment, drives and shared services too. Measure their inputs or use an allocation method you can justify. Record thermal energy and electricity separately. State the energy basis if you then combine them. A reduction in pumping demand alone does not establish a reduction in total plant energy.
Distinguish circulating water from fresh-water demand
The two heads use 270 L/min, equivalent to 16.2 m³/h of nozzle flow. This is circulating process water in the example. Dividing it by 216 kg/h gives 75 L/kg of treated dry web, but that figure counts water passing through the heads.
Assume a separate meter records fresh make-up water at 0.9 m³/h over the same stable period. Fresh make-up intensity is then:
900 L/h ÷ 216 kg/h = 4.17 L/kg, rounded.
The two results answer different questions. The first describes flow through the jets. The second describes water entering the defined loop from the fresh-water supply. Neither should replace the other on a register.
At a stable tank level, the make-up must balance net losses from that loop. Identify purge, water carried away with the web, filter-related losses and other exits. Include cleaning and startup water when calculating a full production-period total. A short stable-run result will omit those uses unless they fall within its measurement period.
ANDRITZ's brochure describes filtration and recirculation as parts of spunlace water processing. Its equipment performance claims are not assumed in this case. The fictional factory must establish its own balance and water-quality limits. A large circulating flow alone does not prove high fresh-water use. It does not establish a recycling percentage either.
Protect jet condition and control water quality
ANDRITZ's neXjet description places a final filter close to the jet strip. It also discusses water distribution and wear at the strip. These are useful features to examine when a persistent band or streak appears in the fabric.
Start by locating the defect across the width and recording when it began. Compare that position with the support, web profile and relevant equipment records. Check whether the pattern continues through a fibre-lot change or follows a maintenance event. Those observations help narrow the investigation before a setting is changed.
Use the equipment supplier's procedures and water-quality requirements for the actual system. A visibly clear sample does not establish every property that affects service. Keep filter condition, pressure and flow records with the trial. Otherwise, a recipe comparison may also contain an unnoticed change in jet condition.
Do not use higher pressure as a general cure for poor uniformity. First establish whether the supplied web and water distribution meet their intended conditions. Changing several variables together may improve the result without showing which action helped. That makes the next recurrence harder to solve.
Check dewatering before attributing a dryer change
Water left in the web becomes part of the drying task. Name the sampling point. Define residual water there as kilograms of water per kilogram of dry material. That ratio differs from moisture expressed as a percentage of the total wet mass.
At 216 kg/h of dry output, suppose the web enters the dryer with 2.0 kg of water per dry kilogram. It carries 432 kg/h of water. A controlled change lowers the ratio to 1.5, so the incoming water becomes 324 kg/h. The difference is 108 kg/h.
If dry output and final moisture remain the same, the dryer must remove 108 kg/h less water. This mass balance does not calculate an exact fuel saving. Actual energy demand also depends on the drying system and its operating conditions. ANDRITZ links dewatering and drying in its systems. The example shows why both measurements belong in the same review.
Confirm that the change preserves the fabric. Record surface, thickness and other relevant responses alongside the water ratio. A lower dryer load is useful only when the finished product still meets its requirements. Keep the sampling method and timing consistent so that handling losses do not distort the comparison.
Choose tests that match the fabric's use
A fabric specification should identify each property, method, sample condition and acceptance rule. Avoid using the broad word strength when the decision depends on a particular test.
Question | Useful evidence | Method scope to check |
|---|---|---|
Is material distributed as intended? | Mass per unit area and its profile | ISO 9073-1:2023 |
Does the strip withstand the required pull? | Breaking force and elongation in stated directions | ISO 9073-3:2023 |
Is the bulk within the agreed range? | Thickness under a specified pressure | ISO 9073-2:1995 |
The public ISO 9073-1 scope concerns mass per unit area. ISO 9073-3 covers strip breaking force and elongation. It defines specimen-width options and tests in conditioned or wet states. ISO 9073-2 addresses thickness under a specified pressure. These summaries help identify a method. The laboratory needs the complete procedure and the agreed requirements to use it.
Mark MD and CD before cutting specimens. Preserve the conditioning and wet-test details. For illustration, an MD breaking force of 90 N and a CD value of 45 N give an MD/CD ratio of 2.0. That ratio does not say whether either result passes. Both could exceed their requirements, or the weaker direction could fail.
Expect different properties to respond differently
Hron, Hinchliffe and Condon's cotton study used a specific cotton precursor. The researchers varied the jet-strip and process conditions. The strip and tear results differed. Higher energy could improve strip strength while tear strength declined, so both needed attention. The study used defined pilot conditions, not a universal production recipe.
Use that finding to frame a trial, not to predict every fibre blend. Define the responses needed for the intended use before choosing the preferred condition. Include agreed surface, wet performance or other tests where relevant. A single favourable result cannot stand in for the whole specification.
Repeat samples across the run and record individual results. An average alone can conceal a weak location or unstable period. Compare like sample conditions and allow the process to reach the intended trial state. Keep transition material identified rather than merging it with the stable-run samples.
Keep maintenance separate from live process adjustment
Jet-strip inspection and cleaning need a planned safe method. Follow the manufacturer's instructions and the site's controls for all relevant energy sources. Stop and isolate equipment, then prevent unintended restart. Release or control stored pressure before work begins. Competent personnel must verify the safe condition for the task.
HSE's maintenance guidance addresses isolation, pressurised pipelines and stored energy. The guidance has a Great Britain regulatory context. Its planning points can also help sites elsewhere develop procedures. Local requirements and the actual equipment remain part of that assessment.
ApparelDiary's HIRA guide can help structure the task review. Define the work, access and isolation points clearly. A production record that says only clean jets does not describe a safe maintenance method.
Questions to settle before approving a new condition
Is a higher pressure always better?
No single pressure proves the best fabric result. The incoming web, jet arrangement, support and handling conditions also matter. Test the properties needed for the product, and consider resource use after the requirements pass.
Can equal kWh/kg values prove two recipes are equivalent?
They establish equality in that calculated metric, provided the boundaries match. They do not establish equal surface, directional properties or stability. Keep the settings and test results beside the energy value.
Does a lower make-up-water figure prove lower total water use?
Only within the measured scope and period. Check startup, cleaning and other water inputs. Compare accepted output on the same basis before claiming an improvement per kilogram.
What belongs in the release record?
Record the product, fibre lots and web basis. Identify the active heads and support, then add pressure-flow readings and speed. Add the water and energy boundaries, test results and accepted-output calculation. State the approved operating range and the actions required when the process leaves it.
Approve the fabric and the operating condition together
To judge hydroentanglement, identify the web and measure the process. Then connect both to the accepted fabric. The worked case gives 46 kW of jet hydraulic power and 216 kg/h of treated dry output. Its energy, water and dewatering figures each describe a different boundary. Keeping those boundaries clear makes the numbers useful.
Choose the condition that meets the product requirements with stable, supportable operation. Preserve the evidence so the next shift can repeat the trial. Use it to judge the next proposed improvement. Keep the pressure setting together with the web, water and test conditions that made it work.



Discussion0
Loading the discussion…