
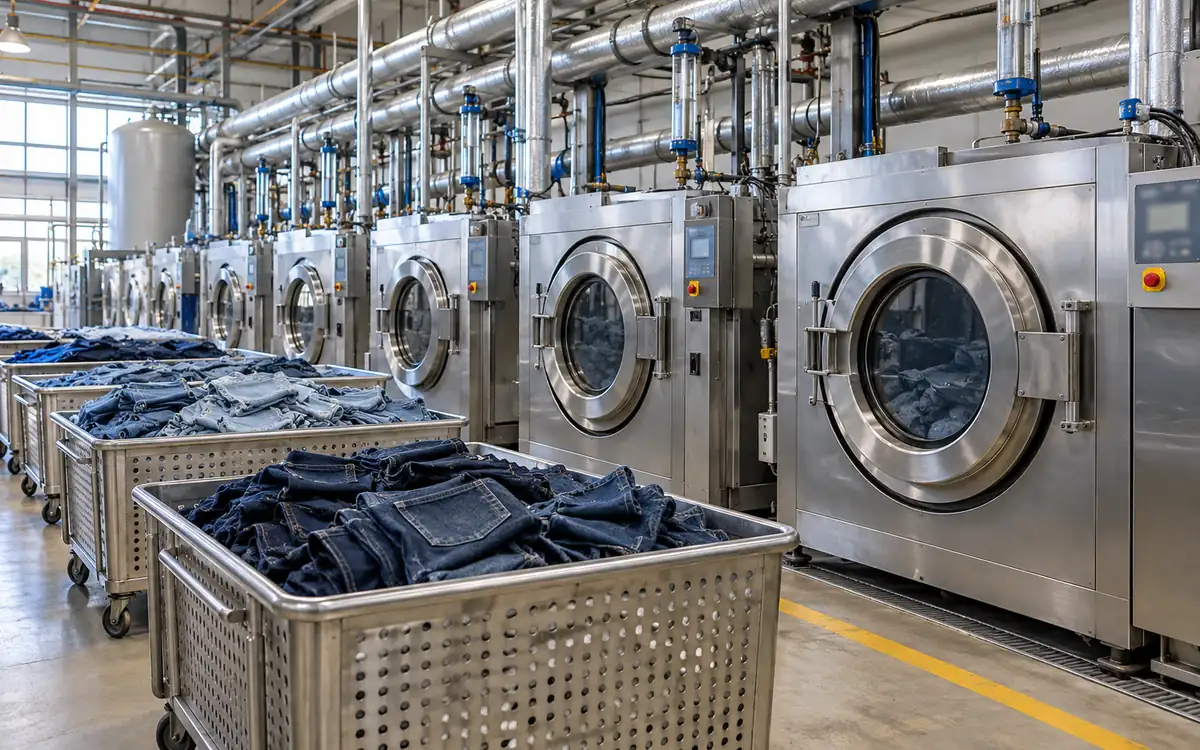
Compare the resources needed for an accepted garment
A denim wash may use less water in its main stage. Total resource use can still be higher than expected. Extra rinses, longer drying or repeat processing can change the result.
The most useful production measure connects resources to accepted output. Track the water, electricity and heat used to deliver accepted garments. The garments must meet the same approved requirements.
That comparison needs a defined boundary. A machine-cycle figure describes one scope. A laundry-department figure or whole-life product footprint describes another.
Begin with the decision you need to make. You may want to compare a new wash route with the current one. Measure both over the same stages. Judge them against the same garment specification.
Keep the individual resource measures visible. A combined score can help. It should not hide increased use of one resource or lower accepted yield.
Define the comparison before collecting data
Write down the product, process and output condition. Include fabric and garment construction. Add the target wash effect, size mix and required performance.
Define where the measurement starts and ends. For example, start when prepared garments enter the wash department. End when dry garments pass the wash-quality checks.
List the included operations. These may include treatment, rinsing, extraction and drying. Add repeat processing and the relevant share of machine cleaning.
Also list important exclusions, such as fabric manufacture, sewing, transport or consumer care. The exclusions keep the result understandable.
ISO 14040 treats goal and scope as part of life-cycle assessment. Use the same clear boundaries in a factory route comparison. That does not make it a complete LCA.
One supplier may estimate only the main process. Another may measure the whole route. Align their boundaries before comparing the figures.
Choose the output unit that fits the decision
Litres per garment is easy to understand. Yet garments can differ greatly in mass and construction. Kilowatt-hours per kilogram can help explain those differences.
For a controlled style comparison, report both where useful:
Resource per accepted garment = total included resource ÷ accepted garment count.
Resource per accepted dry kilogram = total included resource ÷ accepted dry output mass.
Define the dry-mass condition. A warm garment may hold residual moisture. Account for this before comparing it with a settled dry reference.
Use the final accepted quantity after the stated release decisions. Keep original input count in a separate field. Record first-pass accepted count too.
If sizes change between trials, record the size mix. A route with more large garments may process more textile mass. Piece count can stay the same.
Choose a denominator that describes useful output. Do not select it just to favour the new route.
Build a route record with measured and estimated fields
Start with a simple table for each load or linked group of loads.
Field | Record | Why it matters |
|---|---|---|
Product and lot | Record style, fabric lot, size mix and dry mass. | Establishes comparable input. |
Process identity | Record the approved route and actual deviations. | Links resources to the treatment. |
Water | Take meter readings for each defined stream. | Separates fresh and reused inputs. |
Electricity | Take meter readings for included equipment. | Avoids treating nameplate power as energy used. |
Thermal input | Measure steam, fuel or purchased heat. | Keeps heating evidence traceable. |
Rework | Record the extra route, input count and resources. | Makes repeat consumption visible. |
Final output | Count accepted, rejected and unresolved pieces. | Defines the denominator. |
Data quality | Label data as metered, calculated or allocated. | Shows the strength of the evidence. |
Record units at the point of entry. A bare value of 120 can mean litres, kilograms, minutes or kilowatt-hours.
Keep the raw readings. Keep start and end readings with the time interval. These make the calculated total easier to check.
Use meters according to what they measure
A water meter may cover one washer or a shared header. It may cover the whole department. Confirm the physical connection before using the reading.
A shared meter can include another machine filling at the same time. If the trial overlaps that event, part of the reading belongs elsewhere.
Check meter range, condition and the relevant verification status. A meter may be designed for much larger demand. It can then miss small flows or short pulses.
For electricity, use energy readings over the defined interval. Multiplying rated motor power by cycle time gives an estimate. It does not measure energy used.
Keep machine standby and support equipment visible. Pumps, ventilation and controls may operate outside the main cycle.
For utility installation and supply capacity, use the separate factory utility load register. Resource measurement here concerns actual use by a wash route.
Keep fresh water, reused water and circulation separate
A litre of water can pass through several process stages. Counting every internal circulation as new water exaggerates the external input.
Define fresh process water at the chosen boundary. Record reused or recycled supply separately. State whether it comes from outside the boundary or moves within it.
Take an example charge of 9,000 L fresh water. Add 3,000 L of approved reused water. Total charged water is 12,000 L. Reused water accounts for 25% of the charge.
That does not mean the process has reduced total water throughput by 25%. It means one quarter of the stated charge came from the reused stream.
A recirculation pump moving the same bath repeatedly does not create repeated fresh-water use. Record its electricity in the energy account. The water stays within the bath boundary.
Keep quality checks on the reused stream. Contaminated reused water can cause shade variation or rework. Lower fresh input is not a useful gain in that case.
Reconcile water at the department boundary
A simple balance helps find missing streams. Choose a period long enough to account for tanks filling and emptying.
Match incoming water against three quantities. These are water leaving, water retained and changes in storage.
In an example period, the department receives 18.0 m³ of fresh process water. An external treatment system supplies 4.0 m³ of reclaimed water. Total input is 22.0 m³.
The record shows 19.8 m³ to effluent and 1.5 m³ estimated evaporation. Material carries out 0.4 m³. Stored water rises by 0.3 m³. These values sum to 22.0 m³.
These example values were chosen to close the balance. In practice, review uncertainty and missing measurements.
Do not force closure by labelling every difference evaporation. Investigate leaks, unmetered cleaning, tank changes and timing mismatches.
A reused stream may leave and return within the reporting boundary. Do not count it twice.
Include the full wash route in a worked comparison
Consider two hypothetical routes for the same 1,000-piece denim order. Both finish with 980 accepted garments meeting the same specification.
The water boundary includes direct process water, reprocessing and allocated machine cleaning. It excludes boiler makeup and upstream fabric production.
Water component | Current route | Candidate route |
|---|---|---|
Normal processing | 20,000 L | 15,000 L |
Reprocessing | 1,600 L | 2,400 L |
Allocated cleaning | 800 L | 600 L |
Total fresh process water | 22,400 L | 18,000 L |
Accepted garments | 980 | 980 |
The current route uses 22,400 ÷ 980 = 22.86 L per accepted garment.
The candidate uses 18,000 ÷ 980 = 18.37 L per accepted garment.
The reduction is (22,400 − 18,000) ÷ 22,400 × 100 = 19.64%.
Looking only at normal processing would suggest a 25% reduction. The full stated boundary gives a smaller gain. The candidate route uses more water for reprocessing.
Keep first-pass yield visible
Equal final accepted output does not mean equal process stability.
In the hypothetical current route, 950 pieces pass first time. Forty of the remaining pieces are reprocessed, and 30 of those pass. Ten pieces are rejected directly and ten after reprocessing. Final accepted output is 980.
In the candidate route, 930 pieces pass first time. Sixty are reprocessed, and 50 of those pass. Again, ten are rejected directly and ten after reprocessing.
Final accepted yield is 98% for both routes. First-pass yield is 95% for the current route and 93% for the candidate.
The candidate still reduces measured water use in this example. It also creates more repeat work. This may affect delivery, labour and consistency.
Report both outcomes. A resource improvement can be real while another production measure becomes worse. The decision needs the complete evidence.
Keep electricity and thermal energy distinct
Electricity and steam are different input streams. Record each in its measured unit before deciding how to compare them.
Use the same example order. Suppose the current route uses 80 kWh of included electricity. It uses 1,300 kg of steam. The candidate uses 101 kWh and 1,130 kg.
Electricity per accepted piece rises from 80 ÷ 980 = 0.0816 kWh to 101 ÷ 980 = 0.1031 kWh.
Steam per accepted piece falls from 1.327 kg to 1.153 kg.
Electricity rises by 26.25%. Steam mass falls by 13.08%. Adding 80 kWh to 1,300 kg gives a meaningless total.
Converting steam mass to useful or supplied heat needs a defined thermodynamic basis. State the pressure, steam condition and return state.
Likewise, fuel use and delivered heat are not interchangeable. Boiler efficiency and system losses affect their relationship.
Avoid double-counting boiler energy
You may charge the route with measured steam delivered to the machine. State whether boiler losses are counted separately.
The study may instead allocate boiler fuel to the route. This already counts an upstream energy input. Adding the full steam heat to that total would count related energy twice.
Choose one accounting level for each reported total. You can show several levels side by side if their relationship is clear.
Use separate fields for machine electricity, delivered steam and allocated boiler fuel. Explain the conversion and boundary before summing them.
The same principle applies to hot water supplied from a central system. Its heat may already be included in the boiler fuel allocation.
Keep the engineering calculation traceable. A clear set of inputs can be traced to its source. One number labelled “energy use” gives less detail.
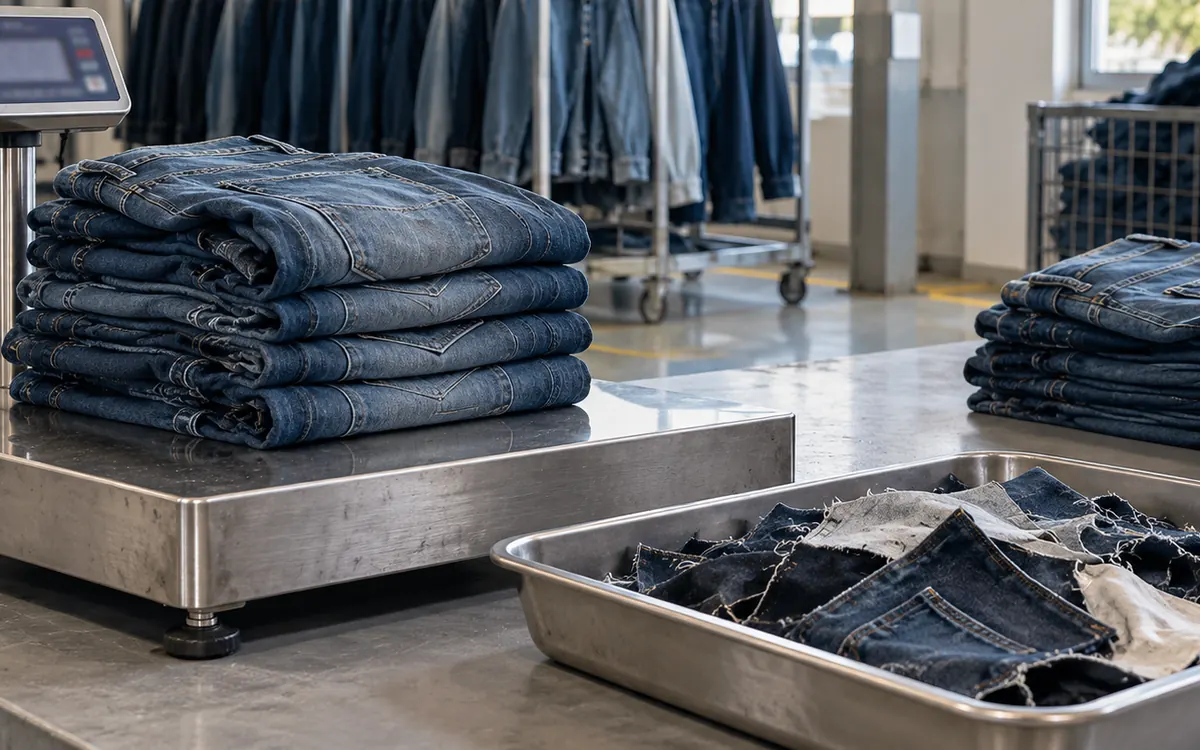
Use heat calculations as checks, not substitute meter readings
A basic sensible-heat estimate can test whether a measured result is plausible.
Take an example 1,200 kg water charge. Heat it from 25°C to 60°C. Use an approximate specific heat of 4.18 kJ per kilogram per degree Celsius.
Heat = mass × specific heat × temperature rise.
The estimate is 1,200 × 4.18 × 35 = 175,560 kJ, or 175.56 MJ. Dividing by 3.6 gives about 48.77 kWh of heat.
This covers only the water's temperature rise. It excludes the garment, vessel, evaporation and heat losses. It is not a complete steam or fuel requirement.
The recorded heat input may be below a defensible minimum. Heat recovery or another source could explain it. If no explanation fits, check the units and boundary.
Conversely, a higher measured input is not automatically waste. Identify the additional loads and losses before deciding what can be improved.
Include extraction and drying in the comparison
More water left in the cloth may increase drying demand. A shorter wash can therefore shift resource use downstream.
Measure the condition entering the dryer. Keep the mass basis consistent and record the drying endpoint used.
Take an example load with 100 kg dry textile mass. A wet mass of 160 kg means it holds 60 kg of water. A revised extraction route gives 145 kg wet mass. Retained water is then 45 kg.
The difference is 15 kg of water entering the drying stage. This does not directly give the fuel saving. Dryer operation and losses still matter.
Check whether the revised extraction affects creasing, distortion or garment damage. Judge energy savings at the same accepted output.
The IFC textile manufacturing guidelines discuss mechanical water removal and water control. They also cover heat recovery. Trial relevant ideas on the actual garment and equipment.
Allocate shared resources transparently
Some resources cannot be metered directly to one load. Cleaning, treatment-plant energy and shared ventilation are common examples.
Choose a basis that reflects the activity as well as the data allow. Record it and use it consistently.
Suppose a shared cleaning operation uses 600 L after three comparable loads. An equal allocation assigns 200 L to each. One load may have caused all the cleaning. In that case, equal allocation could mislead.
For shared energy, operating time can be a useful basis in some cases. Mass or measured flow may be more appropriate in others.
Label allocated values as allocated. Do not present them as direct machine measurements.
Test whether the allocation choice changes the conclusion. A different reasonable allocation may erase the claimed gain. Report that sensitivity before claiming a firm saving.
Read wastewater volume alongside pollutant evidence
Less discharged water does not automatically mean less pollutant mass. Concentration and flow describe different parts of the result.
In a hypothetical stream, 20 m³ at 500 mg/L of a measured parameter corresponds to:
20 × 1,000 × 500 ÷ 1,000,000 = 10 kg.
A second stream of 10 m³ at 1,000 mg/L also corresponds to 10 kg.
The second stream has half the volume and twice the concentration. The calculated mass is unchanged.
Use samples that represent the stream. Define the measured parameter correctly. One concentration reading may not describe a changing discharge.
ZDHC's wastewater and sludge programme includes testing and sludge records. It requires action on non-conformities. Follow the applicable version and local rules. A route-efficiency calculation does not replace those duties.
Keep chemical quantity separate from chemical impact
Fewer kilograms do not prove a safer chemical route. They do not prove lower impact either. Products differ in concentration, function and hazard profile.
Record the exact commercial product and quantity. Keep active-content information where it is relevant and reliably provided.
A concentrate and a diluted product differ. Delivered mass alone cannot compare them fairly. Adding unrelated chemical masses does not measure toxicity.
Jeanologia's EIM platform provides garment-finishing assessment and chemical-related information within a wider system. When using a tool, record its version, boundary and data source.
A simple spreadsheet cannot create a verified EIM score. Do not label an unchecked entry as audited. A model result depends on the quality and scope of its inputs.
Use measured records to support tool inputs. Investigate gaps between estimated and actual operation.
Separate energy reduction from greenhouse-gas reduction
Lower electricity use does not state the emissions saving by itself. Use an appropriate greenhouse-gas calculation to link them.
The GHG Protocol Scope 2 Guidance addresses purchased electricity, steam, heat and cooling. Use applicable factors and reporting rules when making a corporate emissions statement.
For a teaching example, take 100 kWh. Multiply by an assumed factor of 0.40 kg CO₂e/kWh. The result is 40 kg CO₂e. This factor is invented for arithmetic. Do not use it as a real grid value.
Record geography, period, source and method for actual factors. On-site fuel combustion needs its own treatment.
A renewable electricity arrangement does not make the whole route carbon-free. Review other included inputs. Follow the relevant accounting rules.
Keep operational resource findings separate from broader product climate claims.
Combine batches with a weighted result
For several loads, divide total included resources by total accepted output. Do not simply average the per-piece results. That works only when accepted quantities are equal.
Take an example record of two loads. The first uses 2,000 L for 100 accepted pieces. That is 20 L per piece. The second uses 9,000 L for 900 accepted pieces. That is 10 L per piece.
The simple average of 20 and 10 is 15 L per piece. That gives the small load the same influence as the large one.
The combined result is instead 11,000 L ÷ 1,000 accepted pieces = 11 L per piece.
Keep the individual results visible as well. The combined value helps with reporting. The small load's high use may reveal a development, loading or cleaning issue.
Use the same logic for monthly totals. Product mix can change the overall result. Each style's route may be unchanged. Compare like styles or report the mix effect. Then judge how much gain came from process changes.
Separate trial and production use when that distinction helps the decision. Development samples consume real resources. Yet a one-off experiment differs from a stable bulk route. Mixing both into one benchmark can obscure their separate needs. State the boundary clearly. Keep a wider department total too.
Show uncertainty before ranking close results
Meter resolution, allocation and output counting can affect a small reported difference.
Suppose two hypothetical routes use 18.0 and 17.7 m³. The difference is 0.3 m³, or about 1.7% of the first value.
Measurement and allocation uncertainty may be as large as that difference. If so, the ranking may not be reliable.
Repeat under conditions that represent production. Investigate the largest sources of uncertainty. Better measurement may help more than extra decimal places.
Report a sensible number of digits. The calculator may show 18.3673469 L per piece. That does not make the measurements precise to seven decimals.
Also keep unresolved output separate. Some garments may still await inspection. Final accepted output is then unknown.
Make claims that match the measured boundary
A clear claim names the resource, comparison and scope. The example above supports a 19.64% reduction in fresh process water. That claim covers only the stated wash-department boundary.
It does not support the same percentage for the jean's whole life.
Levi Strauss & Co.'s published 2015 LCA covers a much wider product life cycle. It states the period of its data. Do not present those values as a current footprint for all jeans.
Keep historical case studies as context. Use current, relevant evidence for the actual product and claim.
Explain any tradeoff, such as higher electricity or more rework. Make the scope clear so readers do not have to uncover missing stages.
Frequently asked questions
Is the lowest liquor ratio always the best route?
No. Check the complete route and garment quality. Rinsing, drying and rework affect the result per accepted output too.
Should recycled water count as zero water use?
Record it separately from fresh input. Treating and transferring it may still use energy and resources. Do not count internal circulation as new supply.
Can I use motor nameplate power to report measured energy?
It can support an estimate with clear assumptions. It is not a substitute for an energy reading over the actual operating interval.
Is litres per kilogram better than litres per garment?
Both can be useful. Choose the unit that fits the decision. Report product mass and size mix to make the result clear.
Does a resource spreadsheet replace an LCA or environmental score?
No. It provides a defined operational record. Broader assessments need their own methods, boundaries and evidence.
Connect savings to acceptable output
Compare like garments and set a clear process boundary. This is the starting point for reliable denim-washing resource data. Record water streams, electricity and heat separately. Add rework and final accepted output.
Then calculate the result, review uncertainty and explain any tradeoffs. The factory can use these results to improve the route. The buyer receives a claim that matches what was measured.
References
Jeanologia EIM: Assessment modules and scope.
ISO 14040: Life-cycle assessment principles and framework.
Levi Strauss & Co.: The Life Cycle of a Jean, 2015 study.
IFC: Textile manufacturing environmental, health and safety guidelines.

Discussion0
Loading the discussion…