
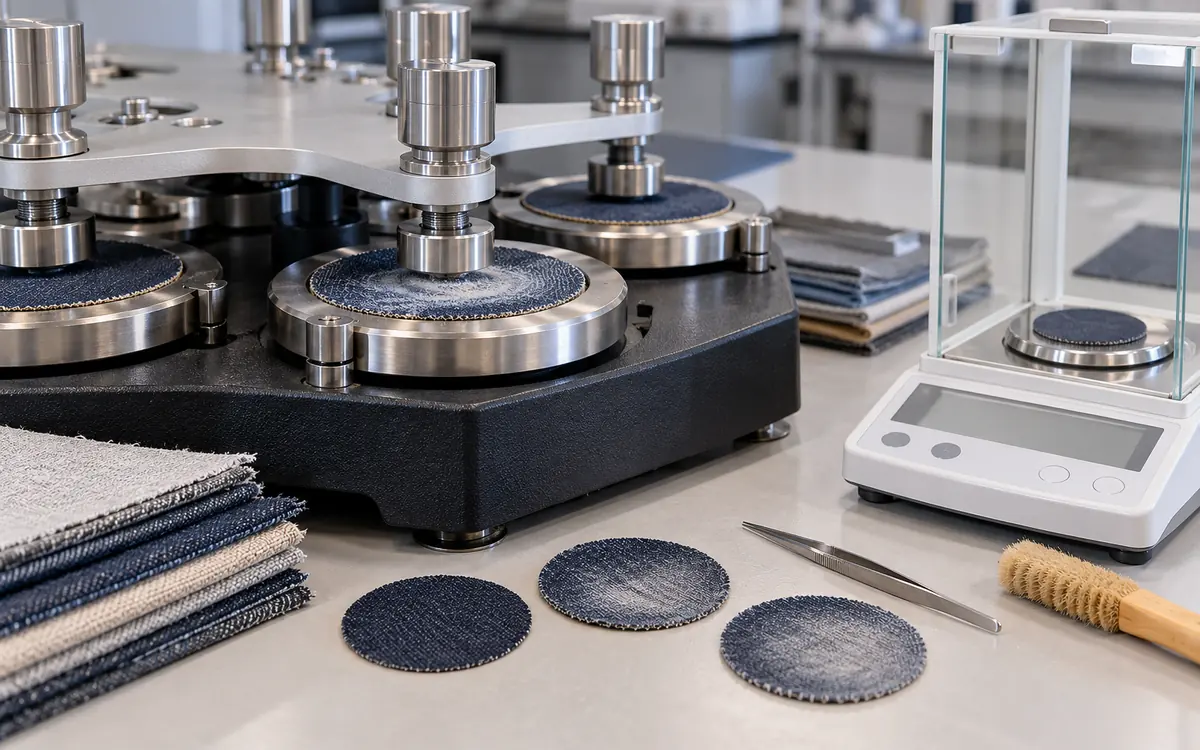
Measure what the rubbing actually changes
A fabric can lose surface colour before it loses much mass. Another can shed fibres while its colour still looks acceptable. A third may become shiny as the surface flattens. These are different forms of abrasion damage. One result should not stand for all of them.
Fabric abrasion mass loss measures a change in specimen mass after a defined rubbing exposure. Appearance assessment records how the exposed surface looks. Together, they help a mill compare finishes, cloth structures, or routes that may otherwise seem alike.
This guide focuses on those two endpoints. It explains how to calculate mass loss, control weighing, compare exposure stages, and investigate an appearance change. All worked results are hypothetical. They show how to measure and decide. They do not set limits for all products.
Choose the endpoint before the test starts
ISO 12947-3:1998 addresses mass loss under the Martindale method. Its scope includes textile fabrics and nonwovens. It excludes cases where the specifier indicates low abrasion wear life. ISO lists the edition as confirmed in 2023. The associated 2002 corrigendum should also be checked when identifying the controlled version.
ISO 12947-4:1998 addresses appearance change. Its scope says the method differs greatly from the mass-loss and breakdown parts. Confirm the full setup and grading route for each endpoint requested.
One test piece may give several observations. That does not make each observation a compliant result under every part of the series. Ask what the method allows. Does it need separate pieces? How will each result be reported? Public scope pages help you choose. The full standards control the work.
Question | Useful result | What the result does not establish |
|---|---|---|
How much mass is lost at a stated exposure? | Mass before and after, with loss in the required units | Remaining strength or appearance acceptance |
How has the surface changed? | Defined appearance assessment against a suitable reference | Amount of fibre removed |
Has the fabric broken down? | A separately defined breakdown result | A complete mass-loss curve |
Will an exposed seam survive its contact? | A suitable seam test | Performance from a flat fabric result alone |
ApparelDiary's seam abrasion guide covers raised stitching and joint failure. Keep that construction question separate from the flat-fabric measurements discussed here.
Establish a meaningful starting mass
The starting mass must refer to the specimen and state defined by the method. Record the face, location, relevant direction, treatment, and sample code. Include the finish code. The measured loss may include more than the base fibres.
Use the required conditioning procedure. ISO 139:2005 defines standard atmospheres for textile conditioning and testing, including an agreed alternative atmosphere. It does not let you choose any room condition just because it is convenient.
Do not call a conditioned mass an oven-dry mass. Those are different measurement states. If a separate study uses drying, state how to dry and cool the cloth. Explain why. Check whether the method allows this before adding it to a standard test.
Record the mass before abrasion after the required preparation. If the cloth needs brushing or other preparation, apply that step to all comparable pieces. Keep the original masses. Do not enter only a calculated percentage.
The balance should weigh the intended object. Include or exclude holders, backing, tape, and other parts as the method requires. A piece of tape added after the first weighing may go unnoticed. Its mass could exceed the small loss you want to measure.
Calculate mass loss in consistent units
For a simple before-and-after comparison:
Mass loss = initial mass − final mass.
If a specimen starts at 0.4000 g and ends at 0.3940 g, its loss is 0.0060 g. Since one gram equals 1,000 milligrams, the loss is 6.0 mg. Keep the unit conversion explicit in the worksheet.
A percentage of starting mass is:
Mass loss percentage = mass loss ÷ initial mass × 100.
For the same specimen, 0.0060 ÷ 0.4000 × 100 = 1.50%.
The percentage can be a useful extra measure when it fits the analysis. Report the quantity required by the method. Do not replace mass loss with an invented index just because it gives a larger number.
Check the subtraction before evaluating trends. If a specimen changes from 487.0 mg to 477.0 mg, the loss is 10.0 mg. If the sheet shows 17.0 mg, check the sum and data entry. This is not an unusual material effect.
Keep full precision in the sums. Round at the end under the reporting rule. More decimal places do not make a better measurement. Values must reflect the balance performance and method needs.
Pair each final mass with its own specimen
A correct total does not prove that individual records are correct. Suppose S1 starts at 320 mg and ends at 314 mg. S2 starts at 400 mg and ends at 388 mg. Their losses are 6 mg and 12 mg. Total loss is 18 mg.
If the two final readings are swapped, the worksheet shows losses of −68 mg and 86 mg. Their total is still 18 mg. An audit of only the combined masses will miss the identity error.
Keep the sample code at every weighing and link it to the machine position. Compare individual results before pooling them. Here, negative loss is a useful warning. But swapping two similar masses might give plausible positive values. Track identity throughout. Do not wait for an odd number to reveal a mistake.
Know what percentage normalisation changes
Two specimens can lose the same mass but different percentages of their starting mass. Neither result is wrong. They answer different questions.
Hypothetical specimen | Starting mass | Final mass | Loss | Loss relative to starting mass |
|---|---|---|---|---|
A | 320.0 mg | 304.0 mg | 16.0 mg | 5.00% |
B | 400.0 mg | 384.0 mg | 16.0 mg | 4.00% |
Both lost 16.0 mg. B lost a smaller share because its starting mass was larger. Before ranking the fabrics, ask why their masses differ. They may differ in mass per area, piece size, structure, or finish add-on.
Dividing by mass does not remove all contact differences. A heavier structure may put more material under the same rubbing area. A raised surface may meet the abradant differently from a flat one. Keep the cloth structure and test conditions beside the relative result.
If a trial reports loss per area, define that area. The full cut piece and nominal rubbed area may differ. Do not choose whichever area gives a better number. That makes the comparison meaningless.
Choose the basis before testing. For a matched finish trial, absolute loss at the same exposure may be most useful. Use the same base cloth. For broader comparisons, both absolute and relative values may help. Still state the remaining structure differences.
Prevent moisture change from looking like fibre loss
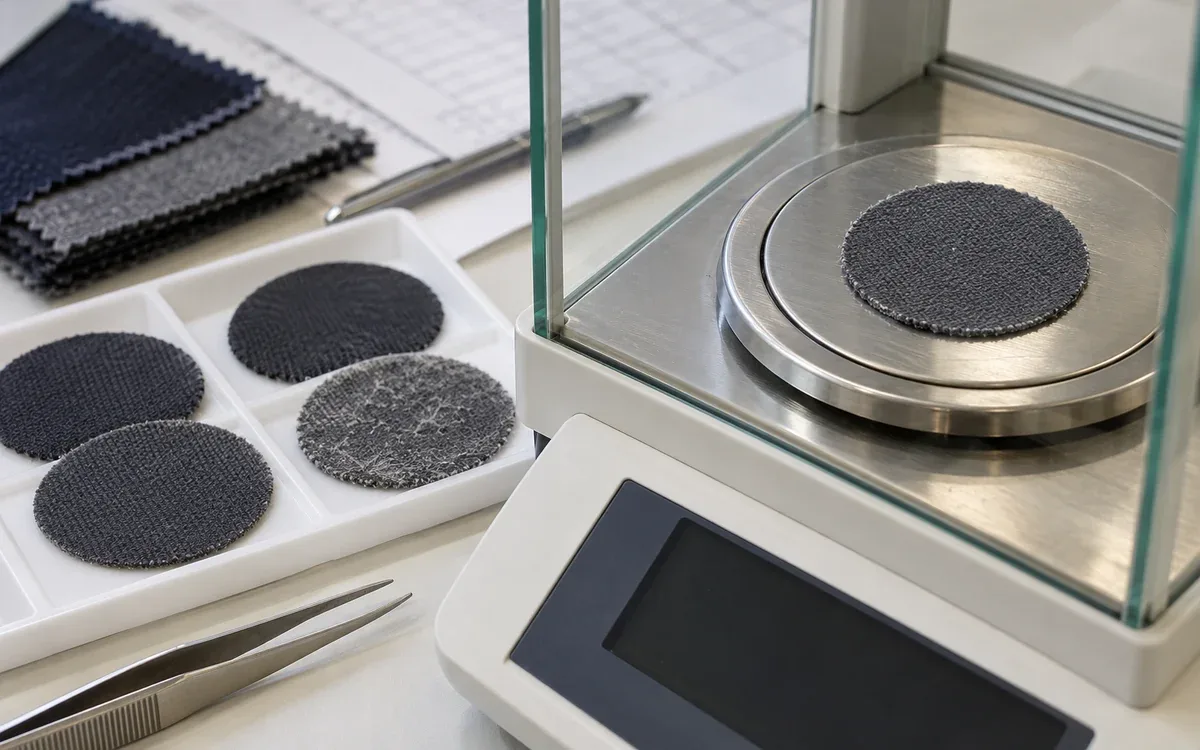
Small mass differences are sensitive to specimen condition. A textile can gain or lose moisture between weighings. Mixing this moisture change with material loss can mislead the team.
Suppose the actual removed material in an invented example is 6.0 mg. Suppose the final piece holds 2.0 mg more moisture than at the start. Measured loss then becomes only 4.0 mg. The understatement is 2.0 ÷ 6.0 × 100, or 33.3%.
The opposite moisture shift would exaggerate the loss. This example does not measure the moisture effect for any specific fibre. It shows why conditioning and weighing order matter. The result is a small difference between two masses.
Mettler Toledo's weighing guidance lists several effects on lab weighing. These include moisture uptake, drying, airflow, vibration, and static forces. A stable display does not remove the need to control the sample and room.
Protect pieces from dirt while they reach the required condition. Use the lab's approved handling method. Keep skin oil and loose fibres off them when moving between machine and balance. Label storage positions so similar-looking worn pieces stay traceable.
Distinguish balance readability from uncertainty
Mettler Toledo's explanation of analytical balance accuracy separates readability from accuracy. Readability is the smallest step on the display. Calibration, repeatability, and use conditions still matter.
For a made-up example, take a 0.1 mg display step. Each reading rounds to the nearest step. Its rounding error can be up to 0.05 mg. Subtracting two readings can then give a worst-case rounding difference of 0.10 mg.
Against a measured loss of 6.0 mg, 0.10 mg represents about 1.67%. Against a loss of 0.20 mg, it represents 50%. These figures cover only the stated rounding model. They are not the full uncertainty of the balance or the abrasion result.
Show that the system can resolve the expected loss in actual use. Repeat weighing of one piece helps check the balance. It does not create more independent abrasion samples. A balance's capacity alone does not prove it suits a tiny difference measurement.
Use the laboratory's verified weighing procedure and check weights. If a result is near the measurement capability, report it honestly. Do not claim an improvement from a difference too small for the system to distinguish reliably.
Treat debris removal as part of the method
Loose particles may remain on a specimen after abrasion. Others may transfer from the rubbing material. Post-test cleaning controls which particles remain in the final mass.
Follow the exact method. Do not invent a strong brushing or vacuuming step. Too little cleaning leaves loose debris. Too much removes material that the method would keep. Both change the endpoint.
Use the same controlled sequence for comparable specimens. Record any visible foreign material, unusual shedding, or damaged edge. Record any departure from the method. Use the lab procedure to decide its effect on validity.
A positive mass change deserves investigation. It does not mean that rubbing created new textile material. Check moisture, contamination, transferred debris, labels, tare, and specimen identity. Keep the positive or negative sign. Do not quietly change every negative loss to zero.
For a separate diagnostic study, collect debris if its origin matters. Microscopy or material analysis may distinguish the specimen from the abradant. Keep this collection study separate if it changes the standard cleaning or contact conditions.
Compare exposure intervals without assuming a constant rate
Mass loss can develop at different rates as the surface changes. A smooth finish may wear away before the yarns below get direct contact. A raised surface may lose loose fibres early, then change more slowly. Record the actual pattern. Do not assume either mechanism.
Consider an invented series measured at equal exposure steps. The same counted unit and valid method arrangement apply throughout.
Cumulative count | Cumulative mass loss | Additional loss since prior stage |
|---|---|---|
2,000 | 1.5 mg | 1.5 mg |
4,000 | 5.0 mg | 3.5 mg |
6,000 | 12.0 mg | 7.0 mg |
The interval losses per 1,000 counted events are 0.75, 1.75, and 3.50 mg. The final cumulative average is 12.0 ÷ 6,000 × 1,000 = 2.00 mg per 1,000 events. That average hides the faster loss in the last interval.
These rates help diagnosis. They do not replace the standard reporting rules. Do not extend a straight line far beyond the measured exposure. The surface and wear process may keep changing.
If separate specimens are used at each stage, label that design. Results then include differences between pieces. If the method allows repeated readings on one piece, keep that paired sequence. Explain the design. Do not mix both designs in a curve without saying so.
Do not borrow a wear index from another apparatus
Taber Industries defines its wear index as mass loss in milligrams per thousand abrasion cycles. For this rate, multiply mass loss by 1,000 and divide by cycles. The Taber machine and test conditions remain part of the result.
For an arithmetic example, 18 mg lost in 1,500 cycles gives 18 × 1,000 ÷ 1,500 = 12 mg per 1,000 cycles. Multiplying 18 by 1,500 and dividing by 1,000 gives 27. That is not the defined wear rate.
Do not call a Martindale result a Taber index just because both rub cloth. Their count units, contact paths, loads, abradants, and sample responses differ. Describe the calculated mass-loss rate clearly. Do not claim that both machines now give the same kind of index.
When comparing supplier reports, retain the instrument and method with the number. A value of 12 from one route and 10 from another cannot rank the cloth yet. First resolve the test basis.
Assess appearance independently of mass
Appearance change can include lightening, gloss, flattening, fuzz, exposed underlying yarns, or loss of a surface effect. Name the feature that matters to the product. Use the grading steps required by the chosen method.
Preserve an unabraded reference in the same starting state. Keep the light, viewing direction, background, and sample display consistent. A directional surface may look different when turned. Record which way it faces if direction matters.
Photographs are useful for locating changes and preserving a sequence. Include a scale and sample identity, and keep capture settings consistent. A photo cannot replace required physical grading unless the method permits it.
Separate colour loss from a light effect caused by surface shape. A shiny patch may look lighter at one angle but not another. Inspect it to choose the next measurement. Do not call every light patch lost dye without evidence.
For coated or special surfaces, check that the method fits the material and endpoint. A coating may lose a key function before much mass is lost. Name that functional check separately if release depends on it.
Use two endpoints in the decision
Suppose a hypothetical fabric brief permits no more than 2.0% mass loss at its stated exposure. It also requires at least grade 4 appearance under the agreed method. These made-up limits are not rules for all products.
Trial route | Mass loss | Appearance grade | Example decision |
|---|---|---|---|
A | 1.2% | 3 | Fails appearance |
B | 1.8% | 4 | Meets both listed requirements |
C | 2.4% | 4–5 | Fails mass loss |
Choosing the lowest mass loss would select A and miss the visible failure. Choosing the best appearance would select C and miss the material-loss requirement. B meets these two conditions, subject to the remaining product checks and a valid sampling plan.
Do not combine the percentage and appearance grade into an arbitrary average. They have different units and meanings. If both requirements serve a product need, assess each directly. A weighted business score may compare options that already pass. It must not erase a failed required property.
Retain individual readings too. Two routes can have similar mean loss but different spread. A local surface defect may matter even when the average is acceptable. Apply the agreed rules for individual pieces and means. Do not choose the better-looking reading of the rule after testing.
Design a trial that separates the likely causes
Start with the observed change. For rapid mass loss, ask where it occurs. Is it widespread, at an edge, or in a surface layer? For gloss or lightening, keep images at the same exposure and direction. Let the observation guide the next comparison.
For a finish study, use matched base fabric and hold the abrasion setup constant. Compare the current and proposed routes. Add a process-only control if extra handling may matter. Keep starting mass and appearance records for each state.
For a construction study, identify all changed variables. A denser fabric with a different yarn and finish is a new material system. A better result may justify choosing it. The trial cannot prove that one change alone caused the gain.
Use the required care state. A finish may improve the first test but change after washing. Keep new and cared pieces separate. Compare each with its own suitable reference. An average of both may represent neither condition.
The public guidance for ASTM D4966-22(2026) identifies test variables and cautions about laboratory comparisons. A controlled in-house trial can support development. Moving a numeric limit between labs may need a separate comparison. Agree a decision rule for that purpose.
Troubleshoot a result that does not make sense
When loss suddenly doubles, check the worksheet and the physical specimens before changing the fabric recipe. Confirm units, decimal placement, sample identity, initial mass, final mass, and counter reading. A gram-to-milligram error creates a thousandfold difference.
If a whole run shifts, check shared conditions. These include the abradant, backing, mounting, load, room, and cleaning. If one position differs, inspect that position and its sample history. These patterns guide checks. They do not prove a cause.
If mass loss is low but appearance is poor, retain both findings. The cloth may lose a key surface effect but little total material. A more sensitive balance will not answer an appearance question that was never measured.
If the balance reading drifts, investigate the weighing system and specimen condition. Do not enter a reading just because it briefly looks good. Use the established stability rule. Keep invalid readings with the reason they were rejected.
Frequently asked questions
Is lower percentage mass loss always better?
It is better only for that defined quantity under a valid comparison. Starting mass, construction, contact, and appearance still matter. A heavier specimen can show a lower percentage while losing the same absolute mass.
Should all fabric be oven-dried before weighing?
No. Use the conditioning and weighing state required by the method. Oven-dry mass and conditioned mass are different bases, and changing the preparation can change the result.
Can appearance stay acceptable after measurable mass loss?
Yes. The two endpoints measure different changes. Record both when the brief requires them. A visible pass does not establish a mass-loss pass, or the reverse.
Can a mass-loss rate predict garment life?
A rate from a defined laboratory exposure describes that test. To predict use, link the test to the product, its contacts, care, and limits. A simple count conversion cannot give that evidence.
Make the abrasion report traceable
A useful report includes the method, fabric state, exposure, specimen identities, starting and final masses, calculation basis, and appearance findings. It records conditioning, relevant deviations, and the decision rule. The reader should be able to repeat the sums without guessing the units.
Keep the conclusion at the level of the evidence. State whether a route reduced measured mass loss, preserved appearance, or met both requirements. This gives the team a clear basis for choosing cloth. It also keeps one attractive number from hiding another form of damage.
References
ISO 12947-3:1998: mass-loss method and scope.
ISO 12947-4:1998: appearance-change method.
ISO 139:2005: textile conditioning and test atmospheres.
Mettler Toledo: factors affecting laboratory weighing.
Mettler Toledo: readability, precision, and accuracy.


Discussion0
Loading the discussion…