
Measure how a fabric hangs under its own weight
A fabric can feel soft in the hand yet form broad, uneven folds in a garment. Another can feel firm in a narrow strip but hang well in a full panel. A drape test helps describe this behavior under a controlled geometry.
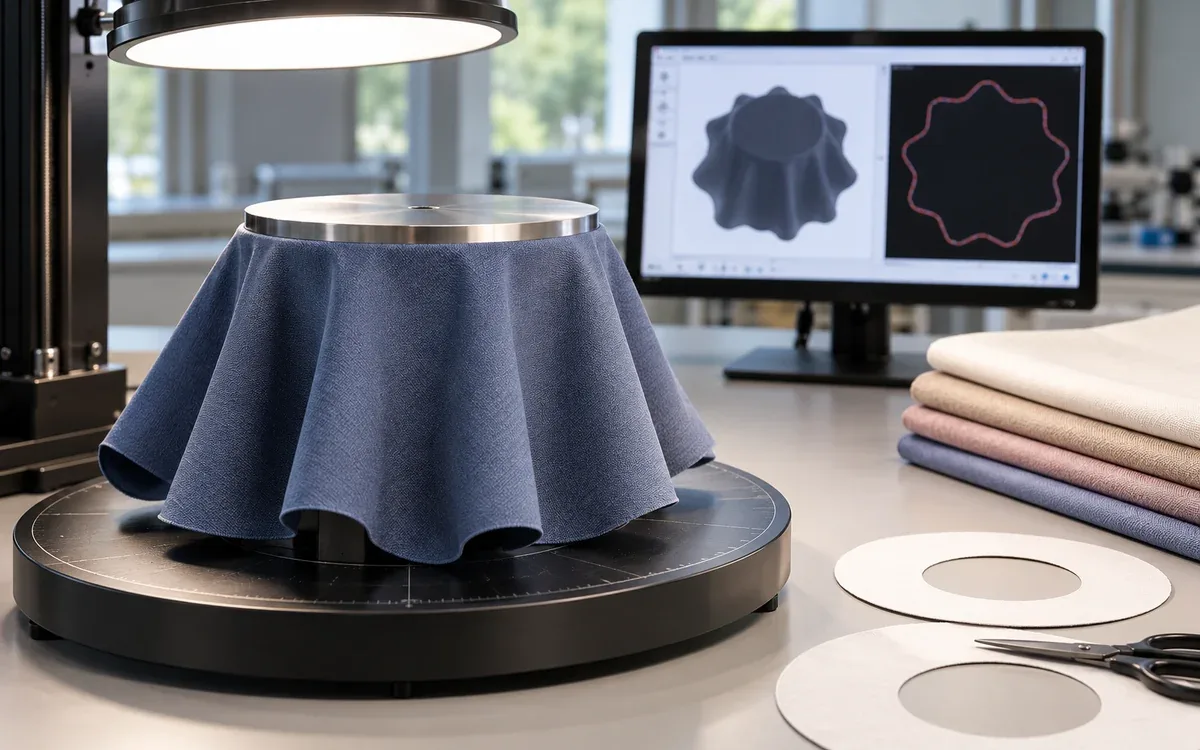
The Cusick approach supports the center of a circular specimen and lets the outer part hang under its own weight. The drape coefficient compares the projected area of the hanging part with its flat area. It gives a useful number for this one static setup.
The number has limits. It does not describe every fold, predict movement while walking, or prove that a garment fits. It does not rank all fabrics from bad to good. A flowing skirt and a structured outer layer may need different behavior.
This guide explains the geometry and sums used in paper and image drape tests. It also covers practical controls. All values and approval examples are made up. They show how to decide, not standard limits for a product type.
Start with the current method and its scope
Although the series title refers to nonwovens, ISO 9073-9:2008 covers drape coefficient tests for nonwovens, wovens, and knits. Its status was confirmed in 2021. The title alone is no reason to exclude every woven apparel fabric.
The standard contains a paper ring method and an image processing method. These provide defined routes for measurement. A photo taken on any support is not by itself a test to that standard.
Cusick's original 1968 paper describes changes for very limp and very stiff cloth. These include a paper weighing technique. This is useful historical evidence. A current production request still needs the exact method and edition agreed by both parties.
Record sample size, support size, face, conditioning, and grading route with the result. Name any established internal method the buyer uses. If a test setup differs from a standard, state that departure. Do not just attach the standard number.
Keep the supported center out of the ratio
The center disc prevents part of the specimen from hanging. The projected footprint includes the support area even when the outer cloth hangs almost straight down. Remove the support area from both areas in the coefficient.
Use three symbols:
A₀ = area of the complete flat circular specimen
Aₛ = area of the central support disc
Aₚ = total projected area of the draped specimen, including the supported center
The drape coefficient is:
DC, % = (Aₚ − Aₛ) ÷ (A₀ − Aₛ) × 100
The numerator is the projected area outside the support. The denominator is the original unsupported ring area. The same area relationship appears in the drape study by Yun and Yun.
This subtraction is the key to the calculation. Dividing the whole shadow by the whole flat circle gives a different ratio. It leaves the supported center in the measurement and can make the coefficient look much larger.
Work through the area calculation
Consider a specimen with a diameter of 30 cm on an 18 cm diameter support. Its specimen radius is 15 cm and support radius is 9 cm.
Area of a circle = π × radius²
Flat specimen area, A₀ = π × 15² = 706.86 cm²
Support area, Aₛ = π × 9² = 254.47 cm²
Unsupported ring area = 706.86 − 254.47 = 452.39 cm²
Assume image analysis gives a total projected area of 450.00 cm². The projected part outside the support is 450.00 − 254.47 = 195.53 cm².
DC = 195.53 ÷ 452.39 × 100 = 43.22%
Use unrounded values during the calculation. The displayed figures above are rounded for clarity.
Now compare the incorrect calculation:
450.00 ÷ 706.86 × 100 = 63.66%
That answer is about 20.44 percentage points higher because the supported center was not removed. The mistake is geometric, not a small rounding effect. Label all three areas in the sheet. This makes the wrong denominator harder to select.
Interpret a higher or lower coefficient carefully
With the same geometry, a higher coefficient means more projected area remains outside the support. A lower value means less of the flat ring area remains visible in projection.
For ordinary unstretched cloth, two limits explain the formula. If cloth stays flat, projected and original areas are equal. DC is then 100%. If the outer part adds almost no projected area, DC approaches zero.
These are geometric limits, not target grades. A coefficient of 40% does not mean “40% stiff.” It also is not a 40% chance of a good garment look. It is the ratio defined by the test.
Use a desired range only when it is linked to product evidence. A brand may build such a range from approved materials and garment trials. Keep the measurement conditions fixed while doing so. A range for one support and sample size may not apply to another.
Understand the paper ring method
The paper method uses mass to compare areas. It assumes that paper mass per area is uniform enough for the test. The ring matches the unsupported part of the flat cloth. The draped outline separates its shadowed part from the rest.
The James Heal Model 665 operator's guide describes how to trace the outline, cut the paper ring, and weigh the required part. It also explains the light and mirror setup.
For the paper ratio:
DC, % = mass of the shadowed part of the paper ring ÷ mass of the complete paper ring × 100
The numerator excludes the center hole. The denominator is the full ring, not a solid circular sheet. Label pieces before doing the sums. Do not confuse the discarded outer part with the shadowed part.
Use the selected method's required handling and precision. The equipment guide explains how to operate it. The adopted test method defines the full measurement and reporting rules.
Check paper masses with a worked example
Assume the complete paper ring weighs 4.00 g. The shadowed part of the ring weighs 1.73 g after cutting.
DC = 1.73 ÷ 4.00 × 100 = 43.25%
This result has no units; grams cancel in the ratio. Convert both masses to kilograms and the answer stays the same. Mixing grams in one field and milligrams in the other gives a wrong answer.
Suppose the full ring has been weighed. Then a 0.05 g label is added to the retained piece. Its apparent mass becomes 1.78 g:
Apparent DC = 1.78 ÷ 4.00 × 100 = 44.50%
The added mass has shifted the result by 1.25 percentage points. Nothing about the fabric changed. This example shows why marks, labels, moisture, and loose scraps deserve attention.
Keep both paper masses in the raw record. A field showing only 43.25% cannot reveal a wrong piece on the balance. It also cannot show if starting mass came from another ring.
Control tracing and cutting errors
A broad pencil line creates a choice: cut along its inner edge, center, or outer edge. That choice changes the retained area. Use a clear outline and consistent cutting rule. Do not choose the cut that looks most favorable.
Paper distortion also matters. A curled ring may not sit in the intended plane. A damaged edge can alter its initial area. Keep paper identity, condition, and storage under control.
Check the balance by suitable procedures. Use the required resolution. In the 4.00 g example, a 0.01 g change in retained mass changes DC by 0.25 percentage points. More digits in a spreadsheet cannot remove that sensitivity.
Weighing retained and discarded pieces can help investigate an odd mass gap. This is a diagnostic check. It does not permit an invented tolerance or changes to make the masses sum exactly. Follow the lab's proven procedure and account for measurement resolution.
When the outline is difficult to trace, record the reason. Resolve faint edges, stray light, or unstable cloth before reporting a confident number.
Use image analysis without losing the geometry
Image analysis estimates areas from a defined image or mask. A mask separates the region counted as fabric from the background. The coefficient still needs the supported area removed.
For a made-up image setup, the flat piece occupies 900,000 pixels. The support covers 324,000 pixels. The draped footprint covers 584,640 pixels. All areas use the same scale and registration.
DC = (584,640 − 324,000) ÷ (900,000 − 324,000) × 100
DC = 260,640 ÷ 576,000 × 100 = 45.25%
Pixels cancel just as square centimeters do. If every area is multiplied by the same scale factor, the ratio stays the same. Camera geometry still matters. Perspective, cropping, and distortion may affect each region differently.
Store the original image, final mask, scale or reference geometry, and areas. A colored outline over a photo helps review. The number still needs a repeatable rule for which pixels count.
Check camera position and edge detection
A tilted camera can distort the footprint. A round support in one view may look oval in another. Position and align the camera as the method requires. Check it with a known reference.
Keep lighting stable. Bright patches, fixture shadows, and uneven backgrounds can confuse edge detection. Automatic exposure may also change the apparent edge between images.
A 2025 study by Toshikj and Mladenovikj compared phone image processing with conventional Cusick tests. It used several sample sizes, camera heights, and software platforms. This shows why image capture setup is part of the measurement. It does not prove that any phone photo gives an equal result.
Record software name, version, and important processing settings. If a person edits the mask, preserve the original and the reason for the edit. A manual correction may remove a real fold or add background. The image may still look neat. Record any such edit.
Quantify sensitivity before ranking close results
The area formula shows how an error in projected area affects DC. With the earlier 30 cm specimen and 18 cm support, the denominator is about 452.39 cm².
A 10 cm² error in projected area changes the coefficient by:
DC change = 10 ÷ 452.39 × 100 = 2.21 percentage points
If the outline is unclear, a small difference between fabrics may be less convincing than it looks.
In the pixel example, including an extra 10,000 pixels in the footprint changes the result by about 1.74 percentage points:
Change = 10,000 ÷ 576,000 × 100
These sums check sensitivity. They do not measure a lab's uncertainty. They show which part needs control. A full uncertainty assessment needs evidence from actual equipment, preparation, and repeat readings.
Do not claim that a fabric at 45.2% has better drape than one at 44.8% merely because the decimal values differ. First ask whether the system and sampling can support that distinction. Then ask whether it matters to the garment.
Keep specimen size in every comparison
The radial overhang changes when the specimen diameter changes. With an 18 cm support, a 24 cm specimen has 3 cm of fabric extending beyond the support radius. A 30 cm specimen has 6 cm, and a 36 cm specimen has 9 cm.
That change affects the physical hanging arrangement. Dividing by ring area does not erase this physical change. Keep results from different sizes separate.
The Model 665 guide lists these three specimen sizes. Select size through the adopted method, including any required early check. Do not give each candidate a different diameter just to get easy-looking comparisons.
A report may show results at more than one specified diameter. Label each one. This may help describe very limp or firm cloth. It does not permit an average that ignores sample size.
Also verify the support dimension. A small error in the support area changes both numerator and denominator. Confusing diameter with radius makes that error much larger.
Control placement, face, and settling
Center the piece on the support without stretching it by mistake. An off-center cut or placement may give unequal overhang before folds form.
Let the specimen settle according to the procedure. Keep the time between placement and capture consistent. Do not hand-shape folds to match a preferred reference. Only a clearly defined research method that requires this would justify it.
Identify which face is upward. Coated, printed, brushed, or unequal faces may behave differently when reversed. Keep the separate readings even if the method needs a combined summary.
Keep the support and contact surfaces clean and suitable for the instrument. An unwanted grip point may hold one spot while the rest hangs free. Record any contact with the surrounding fixture.
If the method requires repeated placements, perform them as specified. Several photos without moving the cloth mainly repeat the imaging step. They do not test whether the cloth forms the same shape after a fresh placement.
Distinguish repeatability from additional samples
Suppose one specimen is placed and measured five times, giving coefficients of 44%, 46%, 45%, 47%, and 43%. Their mean is 45%, and the range is four percentage points.
Those five values describe repeat placements of one specimen. They do not establish the variation across five fabric rolls. Keeping the specimen identity with every reading prevents that confusion.
A trial may need several levels of evidence. Process one photo again. Place one specimen again. Test new pieces from a roll, then pieces from other lots. Each level answers a different question.
Repetition | What it can help examine |
|---|---|
Same image processed again | Stability of the analysis settings |
Same specimen placed again | Placement and fold formation |
New specimens from one roll | Variation within the sampled material |
Samples from other lots | Variation across production lots |
Plan the number of observations through the adopted method and the decision at hand. More readings at one level do not fill a gap at another.
Preserve the shape as well as the coefficient
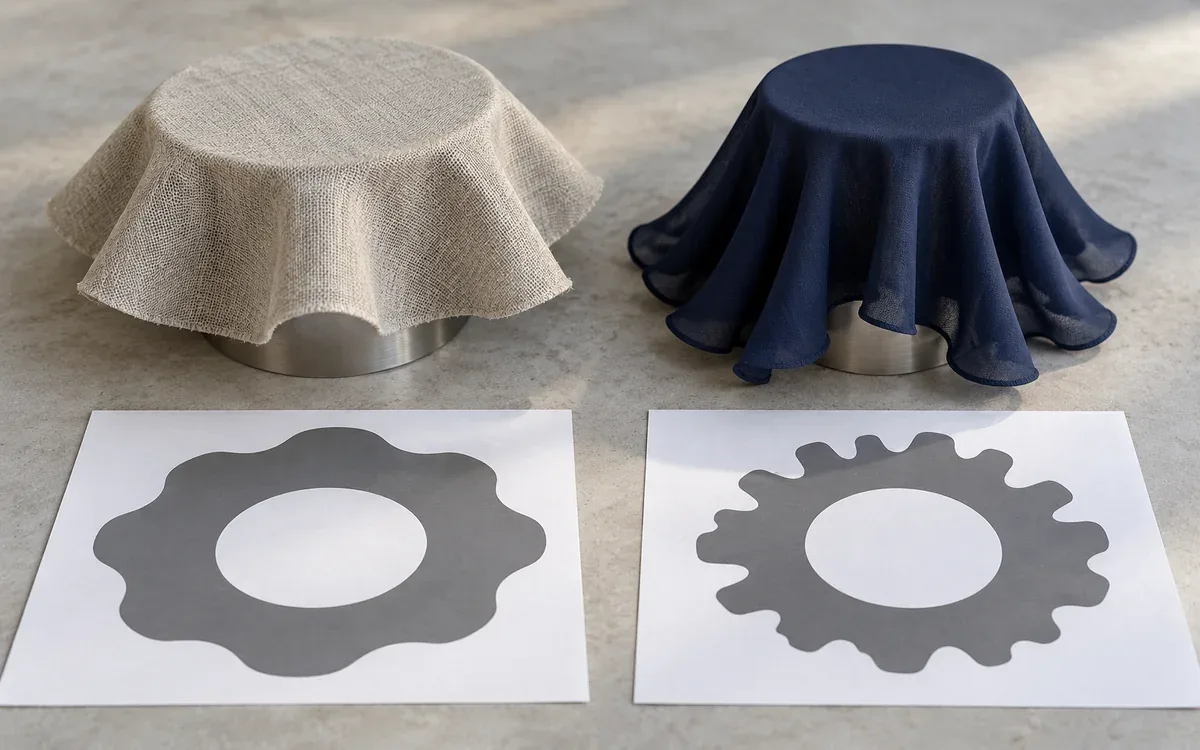
Two projected outlines can cover the same area while forming different folds. One may have a few broad lobes; another may have more narrow lobes. The coefficient alone cannot distinguish all such patterns.
Save the outline alongside the number. Where the method supports them, measure fold count, amplitude, and spacing. These can add useful details. Define each measure so two graders do not count folds differently.
The image processing approach in ISO 9073-9 includes information about drape shape beyond the coefficient. Use those outputs when they answer the product question. Do not invent a combined “drape quality” score without explaining its parts and checking what it means.
In a material collection, keep repeatable numbers, typical images, and the approved garment context together. These help a designer see why similar coefficients can still give different silhouettes.
Keep drape distinct from bending stiffness
Drape reflects the behavior of a sheet under its own weight in several directions. Bending tests isolate another part of the mechanical response.
ASTM D1388-23 measures fabric stiffness through bending length and calculated flexural rigidity. It gives cantilever and heart loop procedures. Those results may help a drape study. They are not Cusick coefficients.
Cusick's 1965 study investigated both bending and shear stiffness. Adding shear improved the relationship studied in those conditions. This shows why drape is more than bending stiffness alone.
Do not assign the same drape behavior to every knit or every woven fabric. Structure, finish, mass, and mechanical response vary within both groups. Measure the actual candidates. Use material details to explain what you see.
If a finish changes both weight and flexibility, a new coefficient records their combined effect in that test. It does not identify which change caused the result.
Add movement evidence when the garment needs it
A static footprint cannot show how cloth swings, settles after movement, or responds to a changing support. These questions matter for garments whose appearance depends strongly on motion.
Yun and Yun's 2023 study used reciprocating movement. It compared fabrics with similar static coefficients but different fold shapes. Movement revealed differences that a static number can miss. Its apparatus settings were research conditions. They are not garment acceptance limits for all products.
Use a separate, defined movement assessment when required. State the sample geometry, motion, viewing conditions, and observations. Link it to the static test. Do not treat the two as the same measure.
A garment trial adds further variables, including panel shape, seams, hems, and support by the body. ApparelDiary's fabric sewability assessment guide explains how to keep construction trials tied to their actual features. A good drape result helps select cloth. It cannot approve every garment assembly made from it.
Build a practical fabric selection decision
Begin with an approved reference material and a clear design aim. Test the reference and candidate under the same conditions. Preserve their shapes, individual results, and material states.
If the candidate has a different coefficient, ask whether that change supports the intended silhouette. If coefficients match but folds differ, review images and shape measures. If a difference appears only after care, study that state directly.
Keep care preparation controlled. ISO 6330:2021 provides domestic washing and drying procedures for textile tests. Keep the chosen care route, drying, and conditioning with the after-care result. Do not press only the candidate to restore a better shape.
Write the release decision in terms of the evidence. A fabric may match a reference within an agreed range and pass the garment trial. Another may require a different panel design. The coefficient informs this choice. It does not make the choice alone.
Frequently asked questions
Is a lower drape coefficient always better?
No. It indicates a smaller projected area under the specified arrangement. The preferred behavior depends on the garment and design.
Can the coefficient be calculated from a solid paper circle?
Only if you correctly remove the support area from the sum. The paper ring ratio uses the unsupported region directly.
Can different camera resolutions give the same result?
Yes, if geometry and included regions are measured consistently. Resolution alone does not fix distortion, a poor edge mask, or missing areas.
Can drape coefficient predict fit?
It can support fabric selection, but fit also depends on the pattern, sizing, construction, and wearer. Assess those through suitable garment work.
Make the coefficient a useful description
A reliable fabric drape test begins with clear geometry and ends with a traceable result. Remove the supported center, preserve the measurement units, and keep specimen size and placement visible. Check the paper pieces or image masks that produced the number.
Use the coefficient together with fold shape and the intended garment context. This helps developers compare cloth and investigate process changes. It also helps explain what the material adds to the finished silhouette.
References
ISO 9073-9:2008: Determination of drapability including drape coefficient.
Cusick, 1968: The Measurement of Fabric Drape.
James Heal: Model 665 Drape Tester Operator's Guide.
Yun and Yun, 2023: Dynamic drapability using reciprocating motion.
Toshikj and Mladenovikj, 2025: Smartphone-Based Digital Image Processing for Fabric Drape Assessment.
ASTM D1388-23: Stiffness of Fabrics.
Cusick, 1965: Dependence of Fabric Drape on Bending and Shear Stiffness.


Discussion0
Loading the discussion…