

A garment factory can have a large electricity bill and still export much of its solar output. A lunch break, weekly holiday, or change in shifts can leave panels producing when factory demand is low. The value of that power depends on the billing rules and the export arrangement.
A sound garment factory rooftop solar payback study starts with this timing problem. It matches solar output and factory demand in each time interval. It then prices the imports avoided, the exports credited, and the costs needed to keep the system working.
The examples below are original and hypothetical. Equipment sizes, yields, prices, and costs are teaching assumptions. They are not market quotations, Bangladesh tariff rates, or promised investment returns.
Define the project before comparing prices
Write a short project basis. Identify the roof, electrical connection, factory loads, and planned operating hours. State whether the proposal covers solar alone or includes storage. Record who will own the equipment and who can use or sell its output.
Use one clear electrical boundary. Solar connected behind one utility meter may not offset purchases through another meter. A common company name does not establish that billing can combine both supplies. Check the actual connection and utility arrangement.
Also define the decision. The factory may compare several array sizes, direct ownership, or a third-party supply contract. A roof replacement may be needed with or without solar. Separate that shared work from costs caused by the solar option.
Do not start with a target payback and work backwards to a convenient yield. Start with measured demand, a defensible generation model, and a complete cost scope.
Keep capacity and energy units separate
Kilowatts describe power. Kilowatt-hours describe energy over time. A system rated at 250 kW does not produce 250 kWh every hour of the year.
Panels have a DC nameplate rating under stated test conditions. Inverters have an AC output rating. Record both. A proposal for 250 kW DC with 200 kW AC is not the same design as 250 kW AC.
The DC-to-AC ratio in that example is 250 ÷ 200 = 1.25. The design may use more panel capacity than inverter capacity for a reason. At some times, the inverter limit may constrain output. The model should capture that effect rather than hiding it in an unexplained loss allowance.
Check exported files too. The PVWatts V8 documentation labels its hourly AC output in watts. Its annual AC output is in kilowatt-hours. A column heading matters as much as the number beneath it.
Build a factory load profile
Obtain interval demand or energy data from the relevant meter. Include normal workdays, holidays, short shifts, and planned shutdowns. A full year is useful when seasons and order volumes change demand. Flag missing periods instead of treating them as zero use.
Keep the meter’s time convention. Identify whether a timestamp marks the start or end of an interval. Check the time zone and any clock changes. A one-hour shift can move the apparent lunch break relative to peak solar output.
If the data are average power in kW, multiply by interval hours to obtain kWh. A 120 kW average over fifteen minutes represents 30 kWh. If the meter already reports interval kWh, do not multiply again.
Review future changes separately. A new line could raise daytime demand. A night-shift expansion might barely change solar use. Base the main case on an agreed operating plan and test other plans as scenarios.
Estimate generation with a documented model
Use the site location, roof layout, panel orientation, tilt, shading, and equipment choices. Record the weather data source and model version. Keep the loss assumptions for soiling, wiring, availability, and other effects visible.
PVWatts offers a practical estimate for a grid-connected system. Its inputs include array type, tilt, azimuth, losses, and the DC-to-AC ratio. The result is a model estimate, not a site performance guarantee. A detailed project may need a fuller shading and electrical study.
The System Advisor Model guidance shows how PVWatts can work with load and electricity-rate inputs. It also supports grid limits and financial analysis. Save the input file with the result so another reviewer can reproduce the case.
Keep weather and factory calendars consistent. A typical weather year is useful for an average estimate. It does not predict the exact cloud cover during a future holiday or factory outage.
Match output and demand in each interval
For a simple solar system without storage, define solar energy as G and factory demand as L in each interval. Both must use kWh and the same interval length.
Direct solar use = minimum of G and L.
Export before any export limit = maximum of G − L and zero.
Grid import = maximum of L − G and zero.
These equations assume the chosen meter boundary and no other generation. Add the actual rules for batteries, generators, and network limits when they exist. Do not force a more complex site into a simple model.
One-hour interval | Solar, kWh | Load, kWh | Direct use, kWh | Export, kWh | Import, kWh |
|---|---|---|---|---|---|
Early morning | 0 | 40 | 0 | 0 | 40 |
Morning work | 80 | 100 | 80 | 0 | 20 |
Midday break | 100 | 60 | 60 | 40 | 0 |
Late afternoon | 20 | 50 | 20 | 0 | 30 |
Total | 200 | 250 | 160 | 40 | 90 |
Annual or daily netting would give only 50 kWh of net purchases for this small example. Yet physical imports are 90 kWh and exports are 40 kWh. The billing system may net them, price them separately, or apply another rule. Physical flow and billing treatment are distinct.
Use two different solar percentages
Self-consumption is the share of solar generation used on site. Solar contribution is the share of site demand met by solar. Neither is a measure of panel efficiency.
For the four-hour example:
Self-consumption = 160 ÷ 200 = 80%.
Solar contribution to demand = 160 ÷ 250 = 64%.
A small array can have almost complete self-consumption while supplying little of the factory’s total demand. A large array may cover more demand but export a larger share of its output. Report both percentages when comparing sizes.
With storage, define whether self-consumption includes energy charged into the battery or energy later delivered from it. The two differ because storage has losses. State the chosen basis and avoid counting the same energy twice.
Treat export limits and billing rules explicitly
Suppose a site has 100 kW of available solar output, 60 kW of load, and a 20 kW export limit. It can use 60 kW and export 20 kW. The remaining 20 kW may need curtailment if no storage or other approved use is available.
A generation model that ignores this constraint can overstate saleable energy. Apply the limit at the relevant interval. An annual cap calculation cannot reproduce every short period of clipping or curtailed export.
Billing may use time-of-use prices, carried credits, demand charges, taxes, and minimum charges. Rebuild the bill under the proposed system. Multiplying all generation by the average bill rate can count costs that solar does not avoid.
Demand charges need their own check. A cloudy interval may still set the monthly peak. A lower annual energy total does not prove a lower billed maximum demand.
Check Bangladesh policy against official records
For a Bangladesh project, use the current official guideline, utility approval, and applicable contract. The Power Division net-metering portal FAQ, checked in October 2026, refers to the 2025 guideline. It states an AC output limit of up to 100% of the customer’s allocated load. It also describes self-use before export and verification of approved equipment.
Those points do not establish a site’s final approval or export value. Confirm the connection category, system design, settlement method, and any conditions with the relevant utility. Keep written evidence in the investment file.
Separate the maximum allowed size from the best economic size. A policy limit is a ceiling. Roof constraints, load timing, export value, and capital cost can favour a smaller project.
Also check the date of any web page used in a proposal. Older public pages can remain accessible after a guideline changes. Record the version and the specific terms applied to the model.
Calculate a transparent first-year payback
Assume a hypothetical system produces 400,000 kWh in its first year. Interval matching shows 300,000 kWh used directly and 100,000 kWh exported. These values already allow for the losses and limits in this teaching case.
Assume avoided import energy is worth $0.12 per kWh. Export is worth $0.04 per kWh under a simplified separate-price arrangement. This example does not model the actual Bangladesh settlement mechanism.
First-year item | Calculation | Amount |
|---|---|---|
Avoided energy purchases | 300,000 × $0.12 | $36,000 |
Export income or credit | 100,000 × $0.04 | $4,000 |
Gross benefit | $36,000 + $4,000 | $40,000 |
Annual operating cost | Assumed | $4,000 |
Net operating benefit | $40,000 − $4,000 | $36,000 |
Initial project cost | Assumed | $180,000 |
Simple first-year payback = $180,000 ÷ $36,000 = 5.0 years.
This is a screening ratio. It does not include finance, tax, degradation, replacements, or the timing of future cash flows. It should not be called a guaranteed five-year recovery period. The full cash model must address those items.
Test a lower self-consumption case
Now assume output remains 400,000 kWh, but factory demand shifts away from sunny hours. Direct use falls to 240,000 kWh and export rises to 160,000 kWh.
Gross benefit = 240,000 × $0.12 + 160,000 × $0.04 = $35,200.
After the same $4,000 operating cost, annual benefit is $31,200. Simple payback becomes $180,000 ÷ $31,200 = 5.77 years. The panels have not become less productive. The output has become less valuable under these assumed prices.
The reverse can happen where export credits are valuable. The correct result comes from the actual settlement terms. Do not impose a fixed discount on exported power when the contract uses another method.
Test lost export approval as a separate case. Set permitted export and its value to the relevant level, then recalculate curtailment and direct use. Merely setting export price to zero may miss a physical export restriction.
Compare array sizes by their added value
Suppose an expansion adds 80,000 kWh per year. The interval model shows only 20,000 kWh of extra direct use. The other 60,000 kWh is exported.
At the assumed prices, its gross annual benefit is $2,400 + $2,400 = $4,800. If it adds $600 of annual cost, the net benefit is $4,200. An added cost of $35,000 gives a simple incremental payback of 8.33 years.
This differs from the five-year average for the first system. Compare the expansion on its own added costs and benefits. A strong small project does not prove that every extra panel is equally attractive.
Check alternate layouts too. A layout with slightly less annual output may better match morning or afternoon demand. Test the whole hourly profile and complete installed cost before choosing it.
Put the roof and electrical work in the cost scope
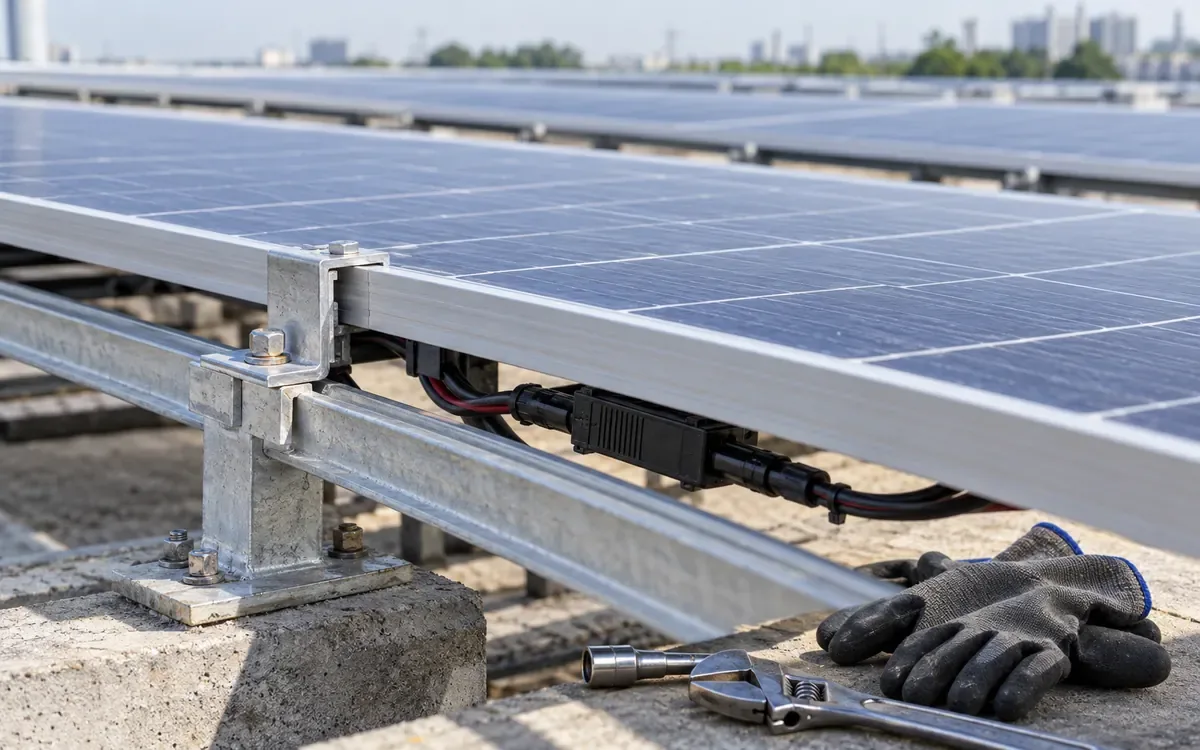
The roof must suit the design and remain serviceable. Have qualified specialists assess structure, attachments, wind effects, drainage, roof condition, and access. An attractive price per installed kilowatt does not resolve those questions.
The NREL solar O&M best-practice guide discusses roof maintenance and the need to coordinate roof and solar work. Future roof repairs can require panel removal and reinstallation. Include that possibility where it is material to the project.
The cost schedule should identify modules, inverters, mounting, cables, protection, meters, controls, design, and commissioning. Include any connection work, structural work, access measures, and monitoring required for the actual site. Show taxes and contingencies on a stated basis.
The Hong Kong EMSD design guidance covers access, protection, and monitoring as technical design concerns. Apply the site’s own rules and qualified design review. Do not treat another jurisdiction’s guidance as local approval.
Model ageing and planned costs over time
Panel output can change with age. Use a supported project assumption and test its effect. A warranty limit, an expected operating trend, and a generation guarantee may describe different things.
For illustration, assume annual output declines by 0.5% from a first-year value of 400,000 kWh:
Year n output = 400,000 × (1 − 0.005)^(n − 1).
Year 2 output is 398,000 kWh. Year 10 output is about 382,356 kWh. This smooth curve is only an assumed scenario. It does not model every fault, weather change, or warranty term.
Recalculate direct use and exports as output changes. Their shares need not stay fixed. Add planned replacements, maintenance costs, and any removal cost at the correct dates. Use ApparelDiary’s factory cash-flow guide to keep prices, discount rates, and timing consistent.
Budget for performance monitoring and service
Assign someone to review generation, alarms, availability, and meter data. Compare output with weather and the system’s expected condition. A low-output month may reflect cloud cover, a failed string, soiling, or a data fault. Those require different responses.
The DOE guide to operating a PV system recommends tracking performance over time. It also addresses preventive work and meter or sensor checks. Monitoring only the electricity bill can hide a fault for weeks.
Set cleaning needs from site conditions and the equipment instructions. Include safe access, water needs, labour, and possible production restrictions. Do not assume that cleaning is costless or that one fixed schedule suits every roof.
Keep fault response and spare-part arrangements in the service scope. Define who investigates an alarm, who approves work, and how long a failed inverter may remain out of service. A warranty alone does not guarantee fast repair.
Evaluate batteries as a separate addition
A battery can shift solar energy to a later hour, but it adds cost and losses. Compare the extra delivered energy and bill savings with those added costs. Do not credit the full charged energy as useful output.
Assume 1,000 kWh of otherwise exportable solar enters storage. With an assumed 90% round-trip efficiency, 900 kWh reaches the load later. At $0.12 per kWh, it avoids $108 of purchases. The lost export value at $0.04 per kWh is $40. The gross shift benefit is $68 before battery costs.
That result excludes wear, standby losses beyond the assumed efficiency, finance, and controls. Demand savings or backup value need separate evidence. A larger self-consumption percentage alone does not prove a profitable battery.
The Australian Government battery guide explains that backup supply requires a suitable configuration. Standard grid-connected solar should not be assumed to operate during a grid outage. Any factory backup system needs an approved design for its loads and operating modes.
Compare ownership with a supply contract
Under direct ownership, the factory pays capital and receives the project’s benefits and obligations. Under a power purchase or similar supply contract, another party may own the system. The factory pays under agreed energy and service terms.
Read the payment basis. Is payment due for all generated energy, only delivered energy, or a minimum quantity? Who receives export credits? What happens during factory shutdowns, grid outages, roof repairs, or a move to a new site?
For a small example, suppose a contract charges $0.08 on all 10,000 kWh generated. The bill is $800. If 8,000 kWh offsets imports at $0.12 and 2,000 kWh earns $0.04, gross value is $1,040. The margin is $240 before other charges.
The result changes if the contract allocates exports or downtime differently. Compare complete annual cash outcomes, service duties, escalation, and exit terms. “No upfront cost” does not mean no long-term commitment.
Accept the system against clear records
Before handover, agree the commissioning checks, metering basis, and documents. Keep the approved design, equipment records, settings, test results, and service contacts. Confirm that the monitoring data can be exported and retained by the party responsible for performance review.
Separate an equipment warranty from a site energy guarantee. If there is a generation guarantee, define the weather basis, exclusions, meter, test period, and remedy. A statement of panel capacity is not a promise of annual cash savings.
Use the first operating months to check the original model. Reconcile solar generation, imports, exports, and factory load on the same periods. Investigate missing data and unexplained residuals. Update the forecast only with a documented reason.
Check meter totals before trusting the forecast
Use the physical energy balance to check the first model and later reports. For a simple site without storage or other generation, load equals grid import plus solar generation minus grid export. All meters must cover the same boundary and period.
Assume a month has 20,000 kWh of grid import, 10,000 kWh of solar generation, and 2,000 kWh of export. The implied load is 28,000 kWh. Direct solar use is 8,000 kWh. These are two checks on the same flow record, not two separate energy savings.
If an independent load meter differs, investigate the boundary first. Transformer losses, an unmetered branch, or a meter on the other side of a shared supply may explain it. Check meter ratios, signs, units, and clocks. Do not label every gap as an equipment loss.
Mark estimated intervals in a separate column. A missing sunny hour is not a zero-generation hour. Likewise, a missing demand value cannot safely be treated as a closed factory. Record the method used to fill gaps and show how much of the annual total depends on it.
Test the uncertainty that matters to the decision. Suppose generation is 10% lower in a stress case and the direct-use share stays at 75%. Direct use becomes 270,000 kWh and export becomes 90,000 kWh. At the teaching prices, gross benefit is $36,000. After $4,000 of annual cost, simple payback rises to 5.63 years.
That fixed-share stress case is easy to review, but it is not a substitute for new interval matching. A weather change may alter direct use and exports in different proportions. State the shortcut and use the fuller model when it could change the choice.
Frequently asked questions
Is annual electricity use enough to size solar?
No. It is a useful starting total, but it hides timing. Use interval demand to show how much output the factory can use directly. Add export and connection limits before choosing the size.
Does a high self-consumption rate mean the best project?
Not by itself. It can improve value where avoided imports are worth more than exports. Still compare total useful output, cost, roof constraints, and the added value of each size option.
Can all solar generation use the average bill rate?
Only if that rate represents the costs actually avoided under the billing rules. Fixed charges, demand charges, taxes, and export credits may need separate treatment. Rebuild the bill to check.
Will solar keep sewing lines running in an outage?
Do not assume so. Backup requires a suitable approved system and enough power for the chosen loads. Confirm inverter behaviour, storage, protection, and starting loads with the designer.
What should a supplier quote include?
It should state the AC and DC ratings, expected generation basis, equipment, full work scope, service duties, and exclusions. Ask for the interval model and the terms behind any performance promise.
Choose a project whose energy and cash flows can be checked
Rooftop solar becomes a clearer decision when each hour has an energy balance and each bill item has a stated rule. Use measured factory demand, a documented generation model, and complete project costs. Test holidays, export limits, faults, and future shifts before relying on a headline payback.
The result should show which system fits the roof, the factory’s load, and the approved connection. It should also show what must remain true for the expected savings to arrive.
References
NLR, PVWatts V8 API documentation.
NLR System Advisor Model, PVWatts model guidance.
Bangladesh Power Division, Net Energy Metering portal FAQ. Policy information checked October 2026.
Hong Kong EMSD, Solar Photovoltaic Systems: Design Considerations.
US Department of Energy, Operate and Maintain an Existing Photovoltaic System.


Discussion0
Loading the discussion…