
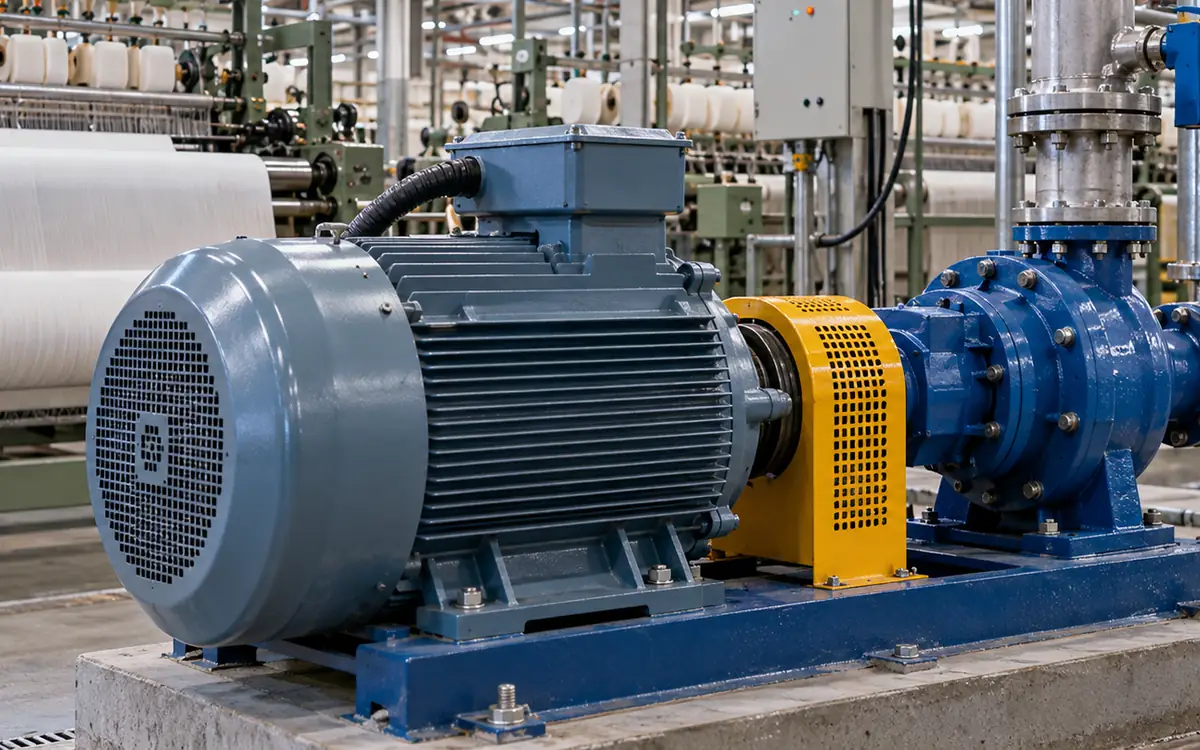
Begin with the work the motor must do
A motor proposal should answer a clear question. How much less electricity will the new motor use to do the same work? The age on the nameplate cannot answer it. Neither can an efficiency label by itself. A standby motor may run for few hours. A loaded pump motor may run all day. Even with the same rating, their replacement cases can differ.
In a textile mill, define the duty at the driven machine. A pump must deliver a stated flow against a stated head. A fan must provide the airflow and pressure that the process needs. A conveyor must move its load at the required speed. Record these duties before comparing motors. Otherwise, a lower power reading may simply mean less work reached production.
This guide develops the engineering case before a purchase. It covers a working motor, a failed motor, and a motor that appears oversized. The numerical examples are hypothetical. They demonstrate a method and do not represent measured savings at a named mill. Use your own load records and supplier data. Get a quote for the full installed cost.
Separate the motor from the system around it
Draw a simple boundary from the electrical supply to the useful output. Electricity may pass through a drive, cables, the motor, a belt, and the driven machine. Each stage can have losses. A new motor changes only part of that chain. A project may also change controls, speed, transmission, or process demand. Record each change.
The motor's nameplate kW usually identifies rated mechanical output. It is not a promise that the motor always draws that amount from the supply. At a given duty, electrical input exceeds shaft output because the motor has losses. A power meter at the drive input includes the drive's losses too. Mark the measurement location on the worksheet.
IEC 60034-30-1:2025 defines efficiency classes for specified line-operated motors. Its scope does not include the efficiency of a complete drive system or losses in converters, cables, and filters. Ask suppliers to state the rating standard and test basis. An IE class describes motor efficiency. A vendor may quote a saving for the whole system. These are different measures.
For an existing installation, retain the current useful duty as the comparison point. If output must increase, show the extra capacity separately. It may justify spending, but it is not an energy saving on the old duty.
Make three different replacement decisions
The first decision concerns a healthy motor that can keep running. Its replacement cost is the full additional cost of removing it now and installing another motor. Allow for any sale value that can be recovered. The old unit may still have useful service left.
The second concerns a failed motor. Production needs a restored service, so a credible repair or equivalent replacement is the comparison. The extra cost of the more efficient choice can be much smaller than its total purchase cost. Obtain a repair inspection and quote before assuming that rewinding is either cheap or wasteful.
The third concerns a change in duty. A pump may now supply fewer machines, or a fan may operate under a new air-balance plan. The motor rating can then be reconsidered with the driven equipment. A smaller motor cannot fix every system fault. The pump curve, transmission, or control sequence may be the problem.
Decision | Credible comparison | Main evidence needed |
|---|---|---|
Replace a working motor early | Continue using the serviceable unit | Load profile, remaining service, installed cost |
Replace after failure | Repair or replace to restore the same duty | Failure findings, repair quality, lead time |
Resize after process change | Meet the revised full duty | Peak torque, starts, overloads, cooling |
Add speed control | Existing control method at equal service | System demand, speed range, drive losses |
Keep these cases on separate lines in the approval paper. Mixing their costs can make the payback look good. Yet it may describe the wrong decision.
Build a duty record that represents production
List the asset number and driven machine. Add the rated output, speed, and supply. Record the enclosure, mounting, and controls. Add repair history and the hours for which the motor is energised. Then identify the production states that change its duty. A large batch, small batch, cleaning period, and waiting period may each have different loads.
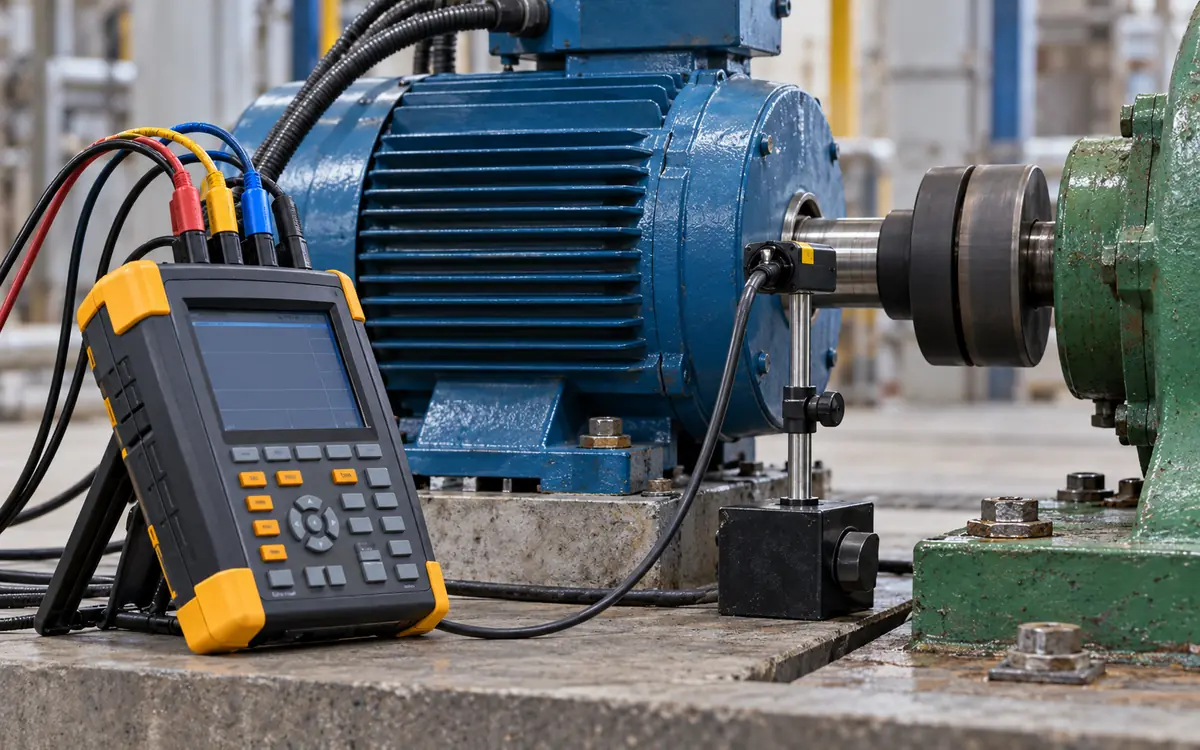
Measure long enough to include those states. A quiet afternoon reading may miss the peak load. The pump may work hardest during a morning fill. Record timestamped input power alongside flow, pressure, speed, or another useful output measure. This turns an electrical trace into an operating record.
The DOE guide to motor load and efficiency describes load estimates based on power, current, and speed. Those methods have different limits. Current is especially easy to misuse at low loads because magnetising current remains present. A small efficiency gap may decide the investment. In that case, one current reading is weak evidence. Obtain better load data.
Use competent electrical staff and suitable instruments for measurements. Do not remove guards or approach live conductors to obtain a better spreadsheet. Some readings cannot be taken safely by hand. State what evidence is missing. Use a suitable fixed or remote measurement system.
Translate power into comparable work
Motor efficiency is the fraction of electrical input that becomes mechanical shaft output:
Efficiency = shaft output power ÷ motor electrical input power.
Therefore, input power = shaft output power ÷ efficiency.
Use efficiencies as decimals in the calculation. For example, 93.5% becomes 0.935. Both powers use kW, so the ratio has no unit. The relationship is simple. The efficiency value must match the load. It must also cover the same equipment as the measurement.
Suppose a hypothetical motor delivers 30 kW at its shaft while its measured input is 33.71 kW. Its implied efficiency is 30 ÷ 33.71, or about 89.0%. If a suitable new motor can deliver the same 30 kW at 93.5%, its input would be 30 ÷ 0.935 = 32.09 kW. The reduction is about 1.62 kW.
This is an engineering estimate based on the assumed efficiencies. Measuring only input power does not independently prove shaft output. If shaft power has been inferred, describe how. A vendor curve, a process balance, and a torque measurement have different uncertainty. Do not label all three as direct measurement.
Work through a mixed-load example
Consider a hypothetical motor with three annual operating states. Assume that the stated shaft loads have been established and that each efficiency is supported by suitable data for its load. The hours total 5,400. The comparison holds speed, useful duty, and all other system losses constant.
Operating state | Shaft output | Annual hours | Existing efficiency | Proposed efficiency |
|---|---|---|---|---|
Main production | 30 kW | 3,000 | 89.0% | 93.5% |
Reduced production | 18 kW | 1,800 | 87.0% | 92.0% |
Low duty | 6 kW | 600 | 75.0% | 82.0% |
For each state, calculate the old and new input power. Multiply their difference by the hours in that state. Do not average the efficiency percentages first. Load and time give each state a different weight.
Annual energy saving = sum of [shaft kW × (1 ÷ old efficiency − 1 ÷ new efficiency) × hours].
Operating state | Existing input | Proposed input | Annual saving |
|---|---|---|---|
Main production | 33.708 kW | 32.086 kW | 4,866.9 kWh |
Reduced production | 20.690 kW | 19.565 kW | 2,024.0 kWh |
Low duty | 8.000 kW | 7.317 kW | 409.8 kWh |
Total | — | — | 7,300.7 kWh |
Existing use is about 143,165 kWh per year. Proposed use is about 135,864 kWh. The saving is 5.10% of existing motor input. It is not 5.10% of the mill's electricity bill. Nor is it the difference between two nameplate efficiency percentages applied to every site load.
At an assumed avoidable energy price of 0.115 currency units per kWh, the annual energy value is about 839.58 currency units. Check demand charges on their own. Review the billing rule. Does this motor run during the billed peak?
Let the comparison determine the payback
Assume the efficient motor costs 4,600 currency units fully installed. For early replacement of a working unit, with no salvage credit or other cost changes, simple payback is 4,600 ÷ 839.58 = 5.48 years.
Now assume the old motor has failed and an acceptable repair would cost 2,800 currency units. If repair and replacement would restore the same service, the additional replacement cost is 4,600 − 2,800 = 1,800. On the same energy assumptions, the incremental payback is 1,800 ÷ 839.58 = 2.14 years.
These results differ because the decisions differ. Neither calculation proves that the new motor will last a particular number of years. Neither includes financing, tax, future tariff changes, or failure costs. Use ApparelDiary's guide to discounting factory cash flows when those items matter to the investment.
Avoid assigning a large downtime saving without evidence. A motor change may improve reliability. But a jammed pump or poor supply may have caused the old failure. If that cause remains, the new motor may face the same problem. Show reliability benefits as separate, supported scenarios rather than using them to hide a weak energy case.
Test the assumptions that could reverse the choice
Hours, load, and the old efficiency often matter more than a small change in purchase price. In the example, reducing all operating hours to 65% lowers the energy value to about 545.72 currency units. Early-replacement payback then rises to 8.43 years. A short-lived order book can therefore change the decision even when the technical comparison is sound.
Test efficiency uncertainty as well. The difference between 89% and 90% existing efficiency looks small, but it changes the estimated saving. Ask which value is measured, which is from an old catalogue, and which is assumed after repair. Show the range of possible efficiency values. A precise cash return can hide a weak estimate.
Create a short sensitivity table with the decision, not every possible variation, in mind. Test lower duty hours and a smaller efficiency gap. Also test cost overruns and a changed electricity price. Use a base case that operations and finance both recognise.
All plausible cases may support the same action. If so, more measurement may add little value. A small change in an assumption may reverse the decision. Resolve that doubt before buying the motor. This keeps survey effort proportionate to the money at risk.
Check speed before accepting the savings
A replacement induction motor may run at a different loaded speed even when its pole count is unchanged. This matters on fans and centrifugal pumps. A small speed increase can raise the driven load and absorb part of the efficiency gain. The DOE motor selection handbook discusses speed, slip, and this replacement issue.
Request the proposed motor's loaded-speed data, then check the effect on the actual machine. Do not assume that the speed on a quotation is the measured running speed at your duty. A belt ratio or drive setting may need a controlled change to preserve the required output.
For a simple illustration, suppose a fan's shaft-power demand followed the cube of speed over a small, comparable range. A 1% speed increase would raise that modelled demand by 1.01³ − 1 = 3.03%. That example is a conditional relationship, not a universal prediction for every fan system. Its purpose is to show why an efficiency calculation must hold useful service constant.
After a trial, compare airflow or process performance as well as kW. Lower input with inadequate extraction is not success. Higher input may be acceptable if output also rises. Assess that as a capacity change. State the new output basis.
Treat repair quality as evidence
Do not apply an automatic efficiency penalty to every rewound motor. The EASA good-practice guide draws on repair and rewind studies and describes methods intended to maintain efficiency. Can the repair shop do the required work for this motor? Can it document the result? Ask for that evidence.
Ask for the failure diagnosis and inspection findings. Request the repair scope and test plan. Confirm the warranty and delivery time. Where appropriate, request records that show how winding and core condition will be controlled. A low quotation with an unclear scope is not directly comparable with a tested repair or a new motor.
Keep the motor's service demands visible. A catalogue match may miss special features. Check the shaft, brake, mounting, enclosure, and supply. Each may affect the replacement. Price the full installation. Include adapters, alignment, guards, and cables. Add control changes and commissioning.
The repair decision can also depend on the spare strategy. A suitable stocked spare may restore production while the failed motor receives a careful assessment. An emergency purchase made during an outage should not become the standard economic rule for all motors in the mill.
Investigate the supply and driven equipment
Repeated overheating should trigger investigation beyond motor age. Supply problems, mechanical drag, poor cooling, misalignment, and unsuitable duty can defeat a new motor too. Review the findings with the electrical and mechanical teams. An old design may not explain every loss.
DOE's voltage-unbalance guidance explains that unequal phase voltages can create larger current imbalance, extra losses, and heating. Use the applicable manufacturer limits and measurement method. Do not confuse a voltage-unbalance percentage with a current-unbalance percentage.
A practical fault record should connect the symptom to an action. For example, “high input at the same pump flow” invites checks of the pump, transmission, supply, and motor. “High input at a higher flow” may first require a duty comparison. “Frequent trips on start” needs a starting and protection review. A more efficient motor may not fix the cause.
Correct an obvious external fault before establishing the replacement baseline. Otherwise, the new motor may receive credit for a separate repair. Record the sequence of work so that the energy calculation remains traceable.
Check torque before choosing a smaller frame
An average load below the nameplate rating does not prove that a smaller motor is suitable. The motor must also start the load, accelerate it in the required time, and handle the real peaks. A textile machine may have a modest average demand but need much more torque during a loaded start or a short process stage.
For a steady rotating shaft, power and torque are related by:
Torque in N·m = 9,550 × shaft power in kW ÷ speed in revolutions per minute.
The constant is rounded and follows from the conversion between minutes, radians, watts, and kilowatts. In a hypothetical example, delivering 30 kW at 1,470 revolutions per minute requires about 195 N·m. A proposed 22 kW motor rated at 1,460 revolutions per minute has rated torque of about 144 N·m. A low average reading elsewhere in the shift does not remove that gap at the required duty.
This simple calculation checks a steady operating point. It does not establish starting torque or acceleration time. Repeated starts need a thermal check. A drive may also limit the available torque. Obtain those characteristics from the equipment supplier. Check the ambient temperature and site altitude. Review cooling and any enclosure change. These can affect the permitted service.
Size the motor for the highest credible demand. A short survey may not capture it. State what peak duty the evidence covers. Ask production about unusual heavy batches, cleaning sequences, and restart conditions. Mark any state that the survey did not capture. If a future order needs the old peak duty, decide whether that duty remains within the approved operating scope.
A clear capacity record prevents a false choice between an oversized motor and a smaller unit that cannot do the job. It may reveal a third option: retain the rating, improve control, or change the driven equipment first. Compare those alternatives on their own evidence.
Evaluate a drive as a separate project
Adding a variable-frequency drive changes the control method and system boundary. It may provide useful savings where the process needs less speed for part of the time. It also introduces its own losses and application requirements. Do not add a generic drive saving to the fixed-speed motor estimate. The two calculations may overlap.
DOE guidance on motor and drive interactions identifies issues such as voltage stress and bearing currents. Assess the motor and drive together. Include the cables, speed range, and protective measures. Follow the equipment makers' requirements for the specific installation.
At low speed, verify cooling and torque capability. At high speed, verify mechanical limits. For a pump, also check that the required head remains available. For a fan, confirm the ventilation duty across the proposed range. These are service constraints, not optional additions to an energy calculation.
If the project includes both a new motor and a drive, show one whole-system comparison at the electrical supply boundary. Then describe the separate reasons for each component. This prevents double counting. Two calculations may claim the same reduction in input.
Write an acceptance test before placing the order
Define the required duty, supply, and mounting in the purchase specification. Add the site conditions and speed range. State the rating evidence needed. Add the measurements that will demonstrate a successful installation. Agreement before purchase is easier than debating a small power difference after the old motor has been removed.
Select representative operating states from the baseline. State the acceptable useful output in each state and the meter location. Record installation changes that could affect the result. Compare like periods, and keep the raw readings rather than only a supplier's percentage summary.
Acceptance question | Evidence to retain |
|---|---|
Does the machine meet its required duty? | Flow, pressure, speed, load, or production result |
Is electrical input measured on the same boundary? | Meter location, settings, timestamps |
Does the motor operate within its specified limits? | Commissioning readings and manufacturer criteria |
Did other changes occur during the trial? | Work orders, control revisions, settings |
Are annual savings based on realistic hours? | Agreed duty schedule and sensitivity case |
After commissioning, use a factory capital-project review to reconcile forecast and actual results. Check the assumptions during normal production. A short demonstration may miss the duty that matters.
Questions that often arise
Should every old motor be replaced?
No. Age can prompt inspection, but it does not establish avoidable energy cost. A serviceable motor with few annual hours may offer little energy value from replacement. A heavily used motor with a verified efficiency gap may be a stronger candidate even if it is younger.
Can the nameplate efficiency be used at every load?
Treat it as a rating at the stated conditions. Obtain suitable part-load information for the duty profile. If only full-load data are available, label the estimate and test how uncertainty affects the decision. Do not present inferred part-load figures as measured facts.
Does a lower current reading prove a saving?
No. Current alone does not state real input power or useful shaft output. Voltage, power factor, waveform, and load can change. Use suitable power measurement and confirm equal service. A smaller current can be useful evidence, but it is not the complete calculation.
Which cost should be divided by annual savings?
Use the additional cost created by the decision being evaluated. Early replacement normally uses the full extra installed cost, less a supportable recovery value. After failure, choose a credible alternative. It may be a repair or another replacement. Compare costs for restoring the same service.
Make the decision specific enough to audit
A sound motor proposal names the asset and duty. It lists the load states and efficiency evidence. It also defines the alternative action. It gives the installed cost and the assumptions that could change the result. It also states how production will confirm that the same work is still being done.
That approach turns a broad promise of efficient equipment into a testable investment. Start with the motors whose operating records and duty make the case clear. Where the evidence is weak, improve the measurement or resolve the fault first. The objective is dependable service at a lower justified lifetime cost.
References
U.S. Department of Energy, Premium Efficiency Motor Selection and Application Guide.
U.S. Department of Energy, Determining Electric Motor Load and Efficiency.
EASA, Good Practice Guide to Maintain Motor Efficiency.
IEC, IEC 60034-30-1:2025: Efficiency Classes of Line Operated AC Motors.
U.S. Department of Energy, Eliminate Voltage Unbalance.
U.S. Department of Energy, Minimize Adverse Motor and Adjustable Speed Drive Interactions.


Discussion0
Loading the discussion…