
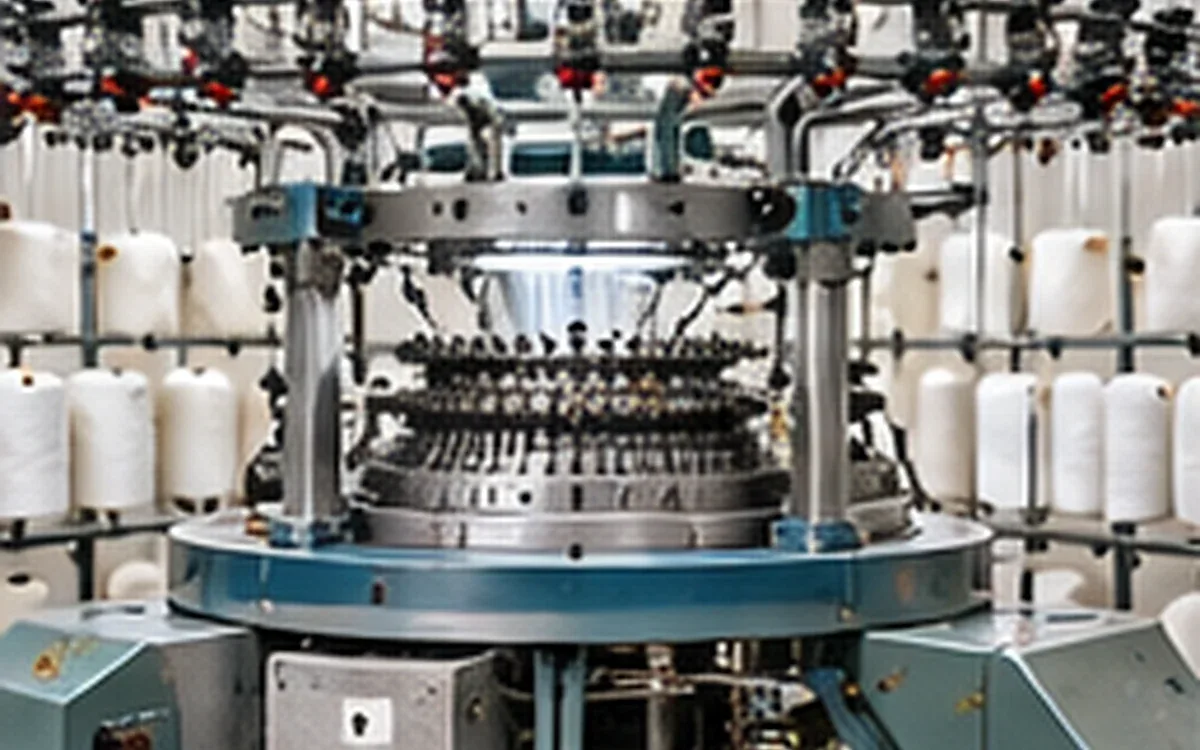
Two yarns can carry the same count on their labels and behave differently on a knitting machine. One may unwind smoothly but give a poor fabric surface. Another may make an attractive swatch yet stop often as the package empties. Neither result is explained by the count or price alone.
Yarn quality for knitting means being able to make the required fabric through the intended process. Variation and loss must stay within the agreed limits. Laboratory results help predict the outcome. A knitting trial brings the parts together: yarn, package, feeding system and fabric construction.
The following approach is aimed mainly at selecting yarn for weft knitting. Warp knitting and specialist products need their own route-specific checks. Every calculation is an original teaching example. The values are assumed; they are not market prices or universal quality limits.
Start with the fabric the customer will use
Write the product requirement before ranking the yarns. State the fibre composition, fabric construction, intended handle, appearance and end use. Include the relevant finished-fabric tests and the process route that will precede them.
A plain dark fabric may expose a yarn difference that is less visible in a textured design. A raised surface has a different purpose from a clear, smooth loop structure. Choosing the lowest hairiness value for both would ignore what each product needs.
Also identify the knitting equipment. Record the machine type, gauge, needle system, active feeders and planned operating range. A simple gauge-to-count formula cannot prove that a yarn will fit the needle and guide system. Bulky, plied and textured yarns need checks on the actual equipment.
Use machine guidance and the planned fabric to choose likely candidates, then test them. Set a clear question for the trial. For example, can a second supplier replace the approved cotton yarn in one jersey quality? It should not attempt to approve that supplier for every machine and product at once.
Describe the yarn beyond its nominal count
The specification should identify the yarn's construction as well as its fibre content. Ring, rotor, compact and filament yarns can have similar mass per unit length. Their structures can still differ. Singles, plied yarns and parallel-fed strands also need clear descriptions.
Cotton Incorporated's Textile Yarns guide explains these yarn structures. It also links knitting performance with softness, torque, elongation and irregularity. Use this background when choosing candidates. It does not provide a universal acceptance table for every knitting route.
An idealised drawing of fibres following perfect helices is a model. It is not a reasonable requirement that every real knitting yarn must meet exactly. Check how the delivered yarn is built and how much it varies. Then check whether it works in the required product.
Confirm what the count label means. For a plied yarn, distinguish the component count from the resultant count. For a blend or covered yarn, identify the component materials and their roles. ApparelDiary's yarn-count guide explains the direct and indirect systems. Those count systems are not quality scores.
Turn a test certificate into questions for the trial
A certificate is most useful when each number has a clear method and purpose. Ask which lot was sampled, how packages were selected and what conditions were used. Compare equivalent measurements before deciding that one supplier has the better result.
The following table is a way to plan questions. It is not a list of acceptance limits.
Yarn characteristic | What to clarify | What to examine during the trial |
|---|---|---|
Linear density | Units, mean and variation between packages | Fabric mass, cover and visible differences |
Twist and direction | Method, construction and consistency | Liveliness, loop appearance and finished distortion |
Breaking force and elongation | Test conditions and spread of results | Break locations and response to knitting loads |
Mass irregularity and faults | Instrument settings, thresholds and tested length | Thick places, holes and repeat marks |
Hairiness | Which index and hair lengths are measured | Fly, surface appearance and finished performance |
Lubricant or finish | Identity, application basis and test conditions | Yarn travel, deposits and compatibility with later processing |
Keep breaking force separate from tenacity, which relates force to linear density. A count of hairs in a length range is one measure. An index based on total protruding fibre length is another. Do not treat them as the same result. A table headed only “strength” or “hairiness” can conceal different measurements.
Do not infer a guaranteed machine outcome from an average tensile result. The average may be satisfactory while a few weak sections still cause trouble. A poor joint or a snagged package can also matter. Keep the distribution and any unusual readings with the mean.
The 2018 Cotton Technology International knitting manual stresses variation within and between packages. It also links yarn choice and stitch length with the planned wet process. Follow the fabric beyond knitting when you assess the trial. Check any older numerical advice before using it as a limit for a new product.
Sample packages as well as lengths
One conveniently placed cone does not represent a delivery. Write a plan for choosing packages across the lot. Keep each package's identity with its results. Include the package condition that will actually be supplied to production.
For an illustrative investigation, a team selects 12 packages from several cartons. It examines three planned positions through each package, giving 36 test sections. Those sections still come from only 12 packages. They are not 36 independent package samples. This selection is an example, not a universal lot-release plan.
The three positions help reveal a change through unwinding. Preserve their order so that a good outside layer does not hide a poor middle or inner section. Record how the sections were reached. Rewinding may make the test easier, but it can change the package and how the yarn has been handled.
Keep conditioning consistent between candidates. Moisture affects mass-based comparisons. Equal package weights need not contain equal fibre mass or equal yarn length. Agree on a moisture basis for the trial and note any change from the planned conditions.
Retain some untreated material from each candidate. If a later result is unexpected, compare it with those samples. They can help show whether the yarn changed during the trial or arrived with that difference. Label them with the lot, package and sampling position rather than only a supplier name.
Check the package-to-needle path
Inspect the cone, tube, nose and edges before running. Look for damage, loose layers, trapped tails or contamination. Confirm that the package is mounted and unwound in the way intended for that build.
Then follow the whole yarn path. Identify the guides, tensioners, stop devices, feeder and needle entry. A damaged guide or incorrect threading can create a misleading comparison between yarns. Correct known machine defects before using the run to judge a supplier.
The feeder's operating mode matters. Memminger-IRO's MPF P page describes a positive feeder. A related version serves constant or variable yarn consumption. The MSF 3 storage feeder uses a yarn store and senses consumption. Its description also covers outlet tension control. These functions belong to specific models. They do not mean that every feeder controls yarn length and tension in the same way.
Record the fitted model and actual mode in the trial. Check that its yarn range and setup are suitable for the candidate. A label such as “electronic feeder” is too broad to establish what was held constant.
Suppose a problem occurs at one feeding position. Under the approved trial procedure, try a suitable comparison package there. Also try the suspect package at a known good position where practical. Check whether the fault follows the position or the package. Those two findings point to different causes.
Keep the two observations separate. Changing the package and guide together may restore production. It will not show which change solved the problem. When rapid recovery is necessary, record that the cause remains uncertain.
Treat friction as an interaction
A friction coefficient describes the interaction between a running yarn and a contact surface. The test conditions form part of that result. It is not a quality score for the yarn alone. A value for one surface may not apply to another guide or needle.
The public guidance for ASTM D3108/D3108M-13(2020) makes this distinction. It covers moving yarn against solid material. Test speed matters, and precision between laboratories can be poor. Clearly label a diagnostic test that uses different conditions.
When two friction reports disagree, first check their methods. Compare the surface, speed, conditioning and test arrangement. If the difference affects acceptance, arrange a suitable check between laboratories using comparable samples. A small numerical difference means little when the methods differ.
Also inspect how the finish behaves during running. A satisfactory average can hide deposits or a change through a package. Check the contact points at planned stages of the trial. Use the same method to observe both yarns.
Avoid assuming that one treatment helps every material. A 2021 paper-yarn experiment compared several finishes. The team used friction, tensile and flat-knitting tests. Wax- and soap-treated samples were difficult to knit in that study. That finding applies to the tested material. It is not a cotton treatment recipe. Check a finish on the yarn and process where you plan to use it.
Separate comparison from optimisation
First ask how each candidate behaves in the approved product setup. Keep the intended fabric construction and key operating conditions comparable. Record the actual settings and results. A setting name alone does not show what the machine did.
If a candidate needs adjustment, make that a second, clearly labelled phase. It may still be a useful yarn if an acceptable setup can be established. Report the yarn together with its revised process. Explain any effect on speed, fabric or cost.
This separation prevents two common errors. A machine repair can help the new yarn perform better. Give the reference yarn the same chance before crediting that gain to the candidate. Equally, do not reject a yarn just because it needs a setup suited to its structure.
For a simple comparison, use repeated blocks on the same suitable machine. You might alternate the reference and candidate, then change which one starts a later block. Keep changeover material outside the measured run. Apply that rule to both candidates.
Alternating the yarns can help reveal a time trend. Temperature, wear and operator changes can still affect the result, so record them. Plan any cleaning needed between runs and allow the process to settle. One candidate should not inherit deposits left by the other.
Do not mix candidates in an ordinary saleable roll just to shorten the test. A mixed diagnostic swatch serves a different purpose and needs a clear label. In a normal product trial, link each yarn lot to its roll and finished sample.
Count the right events over the right exposure
An automatic stop is not always a yarn break. Memminger-IRO's OFW upper detector responds to more than breaks. Snatching and jamming near the package can also trigger it. Its signal alone cannot establish that the yarn failed a tensile requirement.
Define the event categories before comparing runs. Separate confirmed yarn breaks from package snags. Also distinguish a caught joint from a feeder-related stop. If the cause is unclear, record it as unresolved. Do not assign every unknown event to the yarn supplier.
Use the same definitions for both candidates. Record the feeding position, approximate package stage, event location and time to restart. Keep a relevant end or joint for review when the normal inspection procedure allows it.
Check what the exposure number contains
Yarn length is often a useful basis when comparing events along the strand. To estimate length from consumed mass, use the measured linear density. The moisture basis must also be appropriate. For tex, the relationship is:
Length in metres = mass in kilograms × 1,000,000 ÷ tex.
One kilogram of a uniform 20 tex yarn therefore contains 50,000 m, or 50 km. One kilogram at 25 tex contains 40,000 m, or 40 km. Equal masses give different yarn-length exposures. Stops per kilogram can help answer a production-cost question. Stops per kilometre measure a different exposure.
The mass must represent yarn that actually entered the measured process. Subtract the yarn left at the end from the starting amount. Otherwise, consumption will be too high. Record threading waste, changeover rejects and stock returns separately so that each has a clear place in the balance.
For example, a trial starts with 8.0 kg available and ends with 1.5 kg unused. A further 0.5 kg is separately recorded as changeover material outside the measured run. The run consumes 6.0 kg, not the full 8.0 kg. At a uniform 20 tex, that represents 300 km.
This estimate needs comparable masses and a complete stock and loss balance. A direct length counter may give a better exposure measure, but check where it sits and what it counts. Repeated passes over a sensor must not silently become additional unique yarn length.
Keep the total across active ends separate from the length taken by one feeder. A machine revolution is also not a fixed amount of yarn for every construction. Use the production record or a checked length balance. Make sure the chosen counter measures the length you need.
An original comparison with unequal trial lengths
Suppose candidate A records nine confirmed yarn-attributed stops over 300 km. Candidate B records 12 over 600 km. Both runs use the same nominal count and approved fabric construction. The exposure is the sum of the yarn lengths processed across all active ends, counted once.
Measure | Candidate A | Candidate B |
|---|---|---|
Processed yarn length | 300 km | 600 km |
Confirmed yarn-attributed stops | 9 | 12 |
Stops per 100 km | 3.00 | 2.00 |
Mean recovery time per stop | 45 seconds | 35 seconds |
Total recorded recovery time | 6.75 minutes | 7.00 minutes |
For A, the stop rate is 9 ÷ 300 × 100 = 3 per 100 km. For B, it is 12 ÷ 600 × 100 = 2 per 100 km. B has more stops in total because it had twice the exposure, yet its observed rate is lower.
The recovery-time calculation is also useful. A loses 9 × 45 ÷ 60 = 6.75 minutes; B loses 12 × 35 ÷ 60 = 7 minutes. Per 100 km, those become 2.25 minutes and 1.17 minutes, respectively, rounded.
Here each stop interrupts the whole machine, and recovery times do not overlap. Several alarms may occur during that single stop. Count its lost time once, not once for every alarm. If only individual positions stop, keep their position minutes separate from whole-machine elapsed minutes.
The observations favour B on these two measures. They do not prove that B will always perform better, or that its fabric will pass. Repeat the trial across packages and conditions that reflect the planned use. The evidence must be broad enough for the decision.
Follow the trial through the finished fabric
Inspect each trial roll in the greige state. Take samples that represent the roll and use the intended dyeing and finishing route. Keep their identities and process conditions with the results. A clean greige sample cannot prove the final colour, surface or dimensions.
Check the properties the product needs. Look for visible bars, streaks, holes and surface change, and assess the handle. Measure fabric mass and width, with the required durability and dimensional tests. Use the agreed methods and limits. Do not choose a passing pilling grade or shrinkage percentage after seeing the results.
Hairiness deserves particular care. Rieter's archived COM4 knitting report discusses fibre integration and abrasion alongside hairiness. Its material-specific examples show why the relationship with pilling and fly needs context. A lower initial index still needs a fabric check. It cannot by itself promise better wear performance.
Preserve the intended finish when comparing yarns. Changing the mechanical or chemical treatment means that you are comparing two routes. It may be commercially useful, but the yarn alone cannot receive all the credit for the result.
Check repeat samples from more than one roll or package group where the product risk warrants it. A single attractive swatch can miss a variation that appears across a larger run. Keep failed samples as well as the preferred one so the team can see the basis for the decision.
Compare the cost of accepted output
A low purchase price does not always mean a low cost per accepted kilogram of fabric. Define what the calculation covers. Keep physical waste, rejected fabric and stock changes separate instead of combining them into one unexplained loss.
Take an invented greige-knitting case. Each candidate consumes 100 kg of yarn. Work-in-process stock is the same at the start and end. Masses use a comparable basis, and no other yarn component or finish enters this boundary. Rejected material receives no credit in this simplified calculation.
Candidate A costs $3.00/kg and produces 94 kg of accepted greige fabric. Candidate B costs $3.10/kg and produces 98 kg. The remainder consists of recorded waste or fabric outside the acceptance requirement.
A: 100 × $3.00 ÷ 94 = $3.1915 per accepted kg, rounded.
B: 100 × $3.10 ÷ 98 = $3.1633 per accepted kg, rounded.
B's higher purchase price is offset by its better assumed accepted yield. The difference is about $0.0282 per accepted kg. That is a narrow advantage, so the reliability of the yield estimate matters.
To find B's break-even accepted output, divide its $310 yarn cost by A's cost per accepted kilogram. Use A's unrounded value:
$310 ÷ ($300 ÷ 94) = 97.1333 kg, rounded.
On the assumed 100 kg input, B needs an accepted yield of about 97.13% to match A's yarn-only cost. Below that, the ranking reverses under these assumptions.
This does not include machine time, finishing, testing, rework or transport. Add relevant costs with consistent boundaries before making the purchasing decision. A measured conversion cost may already include interruptions. Do not charge those same stops again through an added downtime allowance.
ApparelDiary's GSM and roll-weight guide helps with the mass and area checks used in this decision. Keep sample measurements separate from roll estimates. A moisture change or missing stock entry is not proof of a better yarn yield.
Define what the approval covers
An approval should name the yarn, source lot, package form, product and tested route. Include the relevant laboratory ranges, machine conditions and finished-fabric results. State any adjustment that became part of the acceptable process.
Carry unresolved observations into the next trial. A good fabric result may still leave unexplained package snags to resolve. Test those concerns before granting unrestricted release. A smooth machine run also cannot excuse a failed finished-fabric requirement. Investigate the product failure before letting price decide.
The next delivery should match the agreed yarn identity and quality basis. A changed spinning route, finish or package build may change the process. Review it even if the supplier keeps the same commercial label. Keep enough reference material and records to compare the next supply with the qualified condition.
The useful outcome is a repeatable combination of yarn, machine and finished product. The buying team gains evidence for its choice. Production gains a defined condition it can repeat.
References and technical guidance
Cotton Incorporated: Textile Yarns, yarn construction and end-use requirements.
Cotton Technology International: Management of Quality in Knitting, Part 2, 2018.
Memminger-IRO: MPF P positive feeder and related operating variants.
ASTM D3108/D3108M-13(2020): public scope and interpretation of yarn-to-solid friction.
Rieter: archived technical report on COM4 yarns in knitting.



Discussion0
Loading the discussion…