
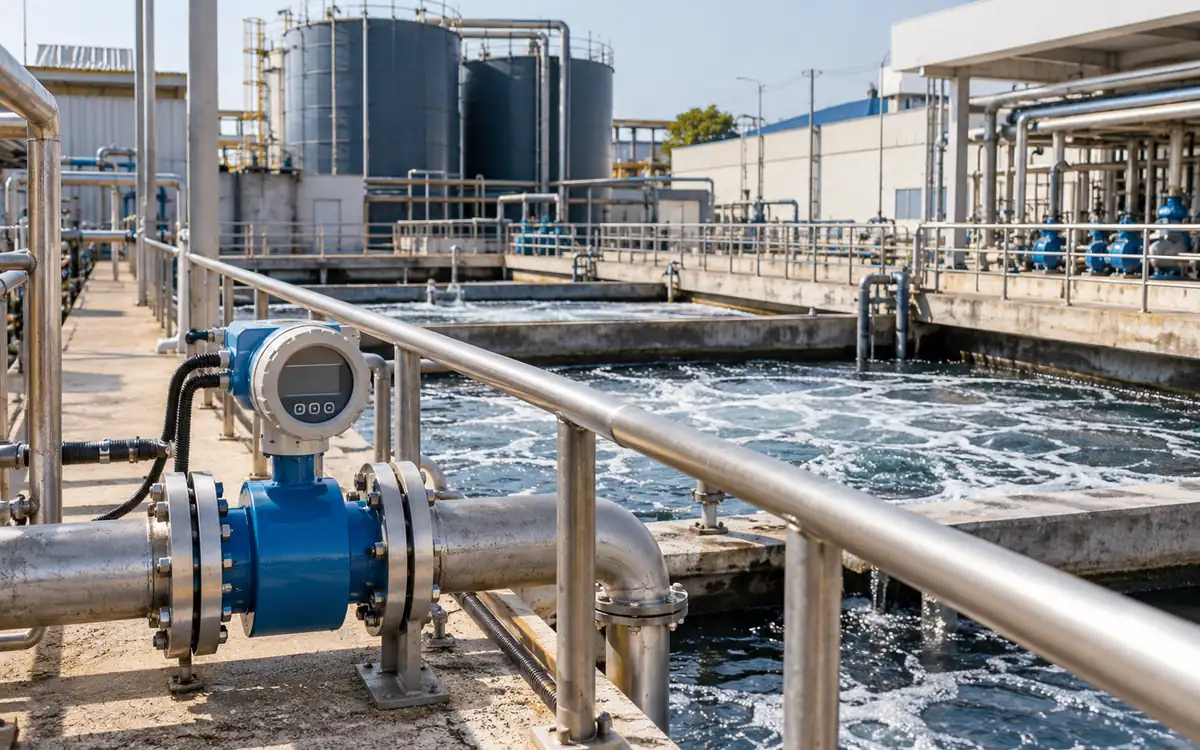
A factory water meter can show a clear total while the water balance remains wrong. One team reads the supply meter at midnight. Another reads the effluent meter at the end of a shift. Reuse flows are added to fresh water, and tank levels are ignored. The spreadsheet then labels the unexplained difference as a leak.
A textile factory water audit should first make those records agree on scope and time. It should show where water enters, where it leaves, and how much remains in storage. Each figure needs a source, a unit, and a clear level of confidence.
This guide builds that audit from the site boundary inward. All worked examples are hypothetical. They show how to reconcile flows and choose better measurements. They are not industry water-use targets or guaranteed savings.
Set one boundary and one purpose
Draw the factory boundary before collecting numbers. Include the buildings, utility systems, water treatment units, and storage tanks inside it. Mark shared systems with neighbouring factories. State whether a central treatment plant sits inside or outside the audit.
List every supply that crosses the boundary. These may include wells, municipal water, delivered water, collected rainwater, and purchased reclaimed water. Water carried in wet raw materials may also matter. Do not assume every inlet appears on the water bill.
Then list water leaving as liquid, vapour, wet product, or wet waste. Mark effluent exported for off-site treatment. Include stormwater where it belongs within the chosen balance. Avoid combining a process-water audit with all rainfall over the whole property unless that is the stated scope.
The EPA water management planning guide uses a facility water balance to find and rank opportunities. Its approach also links efficiency with water quality and supply planning. Adapt the framework to the textile site’s actual flows.
Separate three different water totals
Fresh water intake is the water newly drawn from the named fresh sources. Internal reuse is water transferred for another use within the factory. Circulation is repeated movement around a loop. These totals answer different questions.
A cooling loop may circulate 12,000 cubic metres in one day. It may need only 180 cubic metres of makeup water that day. Adding both numbers as fresh demand would overstate the intake. The loop meter measures service flow; the makeup meter measures replacement water.
Likewise, water leaving a rinse tank and entering another process is an internal transfer. It leaves one department but does not leave the factory. In the whole-site balance, the two internal entries cancel. In a department balance, both must appear.
Keep a flow label beside each number: fresh supply, other external supply, internal reuse, circulation, discharge, or storage change. A dashboard that mixes these labels can show a large “recycling rate” without any fall in source water demand.
Use a conservation equation with a clear sign
For a water balance over a set period:
Water in − water out − increase in stored water = unexplained residual.
A positive storage change means more water remains in the system at the end. A negative change means the site drew down its stocks. Use the same sign rule in every worksheet.
Mass is the strongest basis for a strict balance. Volume in cubic metres is often practical for a factory audit. Use a consistent temperature and density basis where the difference matters. Hot water, concentrated liquor, and wet solids may need a mass conversion.
One cubic metre equals 1,000 litres. A flow of 12 cubic metres per hour for 30 minutes gives 6 cubic metres. A pump’s rated flow is not proof that it delivered that amount. The actual duty and operating time must support the estimate.
Avoid adding percentages from separate streams. A 20% saving in a small utility stream is not a 20% whole-factory saving. Convert each change to the same volume and period before adding it.
Build a meter register that can be checked
Give each meter a unique ID and mark it on the water map. Record the unit, direction, display multiplier, pulse value, and the pipe it measures. Note whether it records total volume, rate, or both.
Add the normal flow range and the meter’s stated accuracy conditions. Record installation details that could affect the reading. These include a partly full pipe, air, deposits, or a poor location for that meter type. Follow the maker’s requirements for the actual device.
The EPA metering guide stresses suitable meter selection, installation, maintenance, and units. It also recommends tracking separate supply sources. A digital display does not remove those basic needs.
Use ApparelDiary’s factory utility load register guide to identify equipment connections. Then add actual water readings for this audit. A register of peak demand and an account of consumed volume serve different purposes.
Register field | Reason it matters |
|---|---|
Meter ID and location | Prevents using the wrong reading |
Stream and direction | Defines which balance receives it |
Unit and multiplier | Prevents thousand-fold errors |
Reading time and time zone | Aligns the audit period |
Flow range and condition | Shows whether the reading is credible |
Test or calibration record | Supports the confidence assigned |
Data owner | Gives errors a clear route for correction |
Align the time window before investigating losses
Use the same start and end time for supply, discharge, and storage readings. Synchronise logger clocks. Record any daylight-saving or time-zone changes if systems use them. Keep the raw timestamps when data are exported.
Suppose the main supply flows at 80 cubic metres per hour. Reading one meter 15 minutes late can shift 20 cubic metres into the wrong day. A daily residual of 20 cubic metres could then come entirely from timing.
Batch operations add another delay. Water may enter a dyeing machine near midnight and leave the next morning. The machine’s contents are part of stored water at the day boundary. Ignoring them makes one day look wasteful and the next unusually efficient.
Choose a period long enough to cover normal cycles. A full production week can be easier to reconcile than one shift. Still keep shorter interval data for finding unusual events. The weekly balance and the hourly trend have different jobs.
Turn flow-rate data into the right volume
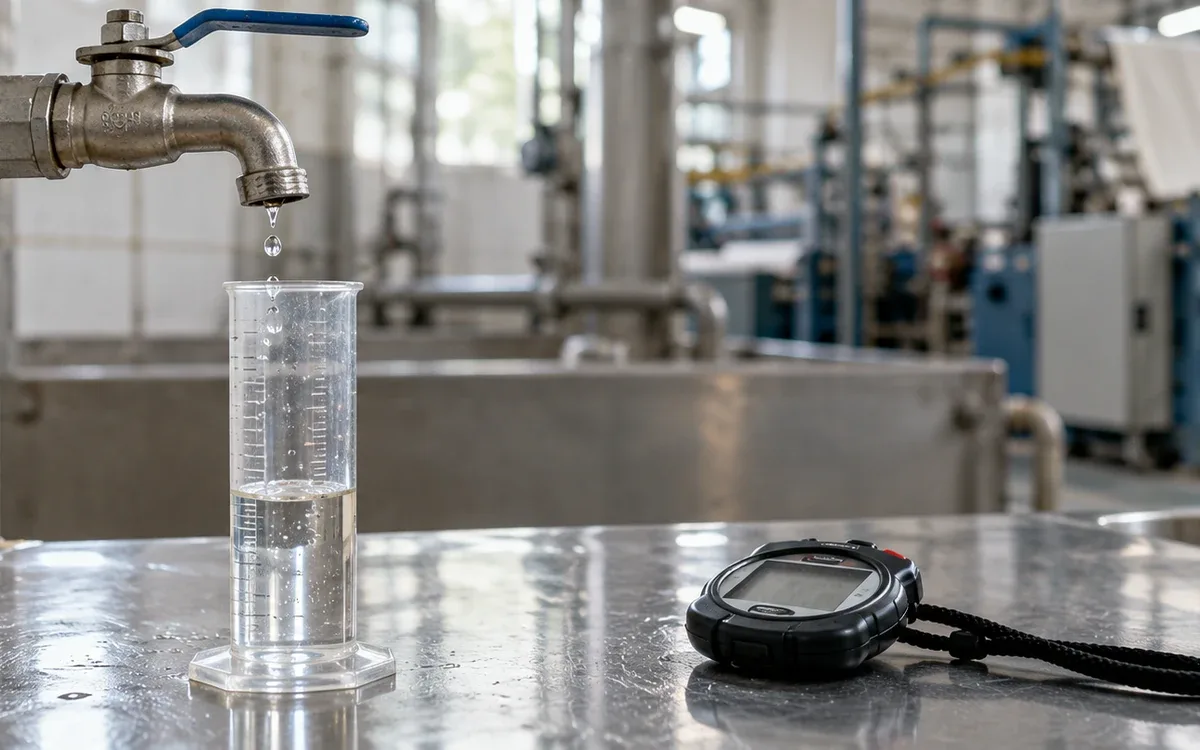
A rate needs a duration before it becomes a water total. For logged data, multiply each average rate by its interval length and sum the volumes. Keep the time unit consistent. Cubic metres per hour need hours, even if the logger exports timestamps every minute.
Consider a hypothetical branch that runs at 10 cubic metres per hour for two hours. It then runs at 4 cubic metres per hour for six hours. Total volume is 10 × 2 + 4 × 6 = 44 cubic metres. Averaging the two rates without time weights gives 7, which would imply 56 cubic metres over eight hours. That answer is wrong.
Check whether each logged value is an average, an instant reading, or a totaliser value. An instant reading can miss brief tank fills. A totaliser may be more reliable for the period total, while rate data help explain its timing. Use both when the system provides them.
Handle missing intervals openly. Do not replace missing values with zero unless the flow was confirmed to be zero. Use a stated estimate where needed and mark its effect on the balance. A full chart can still contain incomplete evidence.
When a totaliser resets or rolls over, preserve the event record. Reconstruct the total using the meter’s documented range and the readings around the event. A large negative daily volume often points to a data problem before it points to an unusual physical flow.
Include tanks, machines, and treatment storage
Record starting and ending volumes in raw water, treated water, hot water, and reuse tanks. Include major process vessels and effluent equalisation tanks. Use a valid level-to-volume relation for each tank shape.
For a vertical tank with constant area, volume change equals surface area times level change. For a horizontal cylinder, level and volume are not proportional across the full depth. Use the tank’s verified table or geometry rather than a simple percentage guess.
An apparent intake reduction may be a storage drawdown. If a site takes 100 cubic metres less from the well while tanks fall by 100 cubic metres, it has not yet shown lower use. The stored supply paid for that day’s reduction.
Do not force every storage estimate to high precision. Focus on volumes large enough to affect the decision. State the estimate and its likely error. A small open sump may matter less than a large equalisation tank whose level varies widely.
Reconcile a complete example
Assume a factory receives 1,000 cubic metres over a common 24-hour period. It has no other material water input within this simplified example. All figures below use a consistent water-volume basis.
Water movement | Volume, m³ | Basis |
|---|---|---|
External water entering | 1,000 | Supply meters |
Liquid effluent leaving | 800 | Outlet meter |
Water leaving as vapour | 120 | Engineering estimate |
Water carried out in product | 5 | Mass and moisture records |
Water carried out in wet waste | 25 | Waste mass and moisture estimate |
Increase in stored water | 20 | Start and end inventory |
Known water out is 800 + 120 + 5 + 25 = 950 cubic metres.
Residual = 1,000 − 950 − 20 = 30 cubic metres.
Residual as a share of input = 30 ÷ 1,000 × 100 = 3%.
The balance is not fully closed. It does not yet prove a 30-cubic-metre leak. Missing flow paths, meter error, stock error, and evaporation estimates could explain some or all of it. Keep “unexplained residual” as the label until the cause is supported.
The factory also reports 240 cubic metres of internal reuse that day. Do not add it to the 1,000-cubic-metre inlet. It is already inside the site boundary. Show it on the internal flow map and in the receiving process’s supply record.
Compare the residual with measurement uncertainty
Assign an uncertainty to each important term. Use meter evidence where available. For estimated evaporation or wet-waste moisture, use a range based on the method and operating variation. Do not give all estimates the same arbitrary percentage.
For the example, assume the following possible absolute errors: intake 10, effluent 16, vapour 18, product water 1, wet-waste water 5, and storage change 4 cubic metres. Their conservative sum is 54 cubic metres.
That simple bound is larger than the 30-cubic-metre residual. It shows why the residual alone cannot establish a leak. It is not a statistical confidence interval. A formal uncertainty calculation would need the error distributions and their relationships.
Do not automatically combine errors by the square-root method. Shared calibration bias or a common estimation method can make errors related. Repeated measurements also do not remove a systematic meter bias.
Choose the next measurement by its value to the decision. Here, better vapour and effluent estimates may reduce doubt more than another small washbasin meter. Reconcile again after improving the weak terms.
Estimate water in product and wet waste
State whether moisture is expressed on a wet or dry basis. They use different denominators. Mixing them can create a large error in fabric carryover or sludge water.
For a hypothetical wet waste load of 10 tonnes with 70% moisture on a wet basis:
Water mass = 10 × 0.70 = 7 tonnes.
Dry solids mass = 10 − 7 = 3 tonnes.
If 70% were a dry-basis moisture ratio, the result would be different. Water would equal 0.70 times dry solids. With the same 10-tonne wet load, water would be 10 × 0.70 ÷ 1.70 = 4.12 tonnes.
Use representative moisture sampling. A single grab from the wettest part of a sludge pile may not represent the shipment. Keep the weighing ticket, sampling method, and laboratory result linked to the balance period.
For product, distinguish water exported from water still in work in progress. Wet fabric held overnight belongs in closing inventory. Water later removed in drying becomes a vapour outlet in that later period.
Make utility water visible without double counting
Cooling tower makeup replaces evaporation, blowdown, drift, and other losses. The tower’s large circulation rate is not the makeup rate. Record the makeup meter and any blowdown meter separately.
The DOE cooling tower guidance explains this balance and the role of water chemistry. Reducing blowdown requires a suitable treatment plan. A water target should not lead operators to exceed safe chemistry limits.
For boilers, trace fresh makeup, returned condensate, steam use, blowdown, and vent losses. If condensate stays inside the site, it is an internal return. Counting it as both new supply and recovered water distorts the whole-site balance.
For water treatment, identify backwash and reject streams. A treatment inlet meter may feed both useful water and a reject outlet. If the reject is reused elsewhere, label that transfer. If it goes to the effluent plant, it remains inside the site until final discharge.
Investigate unusual flow with a planned test
The EPA leak detection guide recommends meter checks and inspection during periods of low or no planned use. In a factory, first identify the loads that must remain on. Cooling, hygiene, treatment, and fire protection may impose real constraints.
A steady night flow is a clue, not proof of leakage. A tank may be filling, a treatment filter may be backwashing, or a cooling tower may still run. Record those scheduled uses before setting the expected minimum.
Suppose the inlet remains at 6 cubic metres per hour during a quiet period. Known loads total 4.5. The unexplained 1.5 cubic metres per hour deserves investigation. It is not yet an annual loss estimate because its duration is unknown.
Use an approved isolation or observation plan to narrow the branch. Protect process and safety needs. After repair, repeat the same test. Keep the before-and-after readings and the operating conditions with the work order.
Check reuse at the source and at the destination
A possible reuse stream needs more than a suitable volume. Record its quality, temperature, timing, and variability. Then compare those features with the receiving process’s needs. A weekly average can hide an unusable supply pattern.
For example, assume 100 cubic metres of suitable rinse water arrives on one day. The receiving use needs 20 cubic metres each day. Reusing all of it requires enough storage and acceptable holding conditions. Without storage, the same-day saving may be only 20 cubic metres.
Evaluate the added pumping, treatment, and monitoring. Check whether reuse changes shade, deposits, odour, corrosion, or product quality. Document cross-connection controls where different water qualities share the site.
The IFC textile EHS guidance describes process-specific water and pollution controls. Its examples show why the process and contaminant matter. They should not be treated as permission to send any treated stream to any use.
Preserve water quality while reducing volume
A smaller volume can spend longer in a tank or pipe. A change that saves water may therefore alter residence time and quality. In drinking-water systems, keep the approved water safety controls intact.
The EPA water quality guidance discusses water age and stagnation. It links water management with quality risks in building systems. This is a reason to review operating changes with the responsible water-quality team.
For process water, define the required properties at the point of use. A source sample may differ from water after storage. Include the treatment, distribution, and final use in the sampling plan. A low intake number cannot compensate for damaged product or unsafe water.
Use fair comparisons across weeks
Keep absolute intake beside any production ratio. One shows the demand on the water source. The other helps explain output changes. Neither should replace the detailed balance.
State the product basis. Kilograms entering wet processing differ from kilograms of saleable finished goods. A garment count also hides changes in garment mass. Use a stable definition and show any change in scope.
Compare similar operating periods. Product mix, shade depth, cleaning, weather, and rework can all affect water demand. If those factors change, explain them before claiming that staff performance improved or worsened.
Avoid a universal litres-per-kilogram target for every textile plant. A sewing-only unit and a wet-processing mill have different boundaries. Use relevant process data and agreed quality needs to set a useful local target.
Convert an opportunity into a checked business case
Assume a proposed control change saves 40 cubic metres of fresh water per day for 300 days. Annual avoided intake is 12,000 cubic metres. Assume it also reduces treated effluent by 28 cubic metres per day, or 8,400 per year.
At hypothetical variable costs of $0.35 per cubic metre of fresh water and $0.25 per cubic metre of effluent, the annual benefit is:
12,000 × $0.35 + 8,400 × $0.25 = $6,300.
These are teaching prices, not market tariffs. Add or subtract measured changes in energy, chemicals, waste handling, and maintenance. Include only costs that actually change. A fixed monthly charge may remain unchanged after the saving.
Check overlap between projects. If leak repair removes water that a reuse project expected to recover, their separate saving estimates cannot simply be added. Evaluate the combined flow map and apply each change to the remaining demand.
Give the audit an operating owner
Maintain one version of the water map and meter register. Keep raw readings separate from corrected data. Log the reason, author, and date for each correction. A reviewer should be able to reproduce the totals.
Assign each opportunity to a person who can act on it. State the proposed change, expected volume, quality checks, cost basis, and verification method. Separate an identified opportunity from an approved project and a measured result.
Close the loop after the change. Reconcile the same boundary again. Check whether lower intake came from a real saving, a storage change, or lower production. Update the operating standard only after the result is supported.
Troubleshooting a balance that will not close
Symptom | First checks |
|---|---|
Discharge exceeds recorded intake | Other supplies, rain inflow, stock drawdown, meter units |
Residual changes sign each day | Batch timing and storage records |
One branch exceeds the main meter | Overlapping meters, circulation, multiplier error |
Reuse rises but intake stays flat | New demand, storage, overflow, or counting method |
Sudden zero reading | Logger failure, meter reset, bypass, or true shutdown |
Saving vanishes after a week | Control drift, different duty, or initial stock change |
Frequently asked questions
Does a small residual prove that there are no leaks?
No. Errors can cancel, and a leak may sit within the uncertainty of the balance. A small residual is useful evidence, but it does not replace inspection or interval checks.
Can an audit begin without meters on every process?
Yes. Start with verified main supplies and major uses. Use clearly labelled estimates for smaller streams. Add meters where uncertainty blocks a useful decision or prevents verification.
Should recycled water appear in the site inlet total?
Only if it crosses the defined boundary from outside. Internal reuse belongs on the internal flow map. Report it separately so readers can distinguish recovered service from new source demand.
How often should the balance be reviewed?
Choose a period that fits the process and the risk. Review key flows frequently enough to act on faults. Rebuild the map after major equipment, pipe, product, or treatment changes.
Make every unexplained volume useful
A good water audit makes the factory’s account testable. It aligns the readings, includes storage, separates reuse from fresh supply, and states uncertainty. That turns a vague water-loss figure into a clear set of checks.
Use those checks to improve the data and select practical changes. Then prove the result at the same boundary. The aim is a water balance that supports decisions and remains useful after the audit team leaves.
References
EPA WaterSense at Work: Water Management Planning, November 2023.
EPA WaterSense at Work: Metering and Submetering, November 2023.
EPA WaterSense at Work: Leak Detection and Repair, November 2023.
U.S. Department of Energy: Cooling Tower Management.
IFC: Environmental, Health, and Safety Guidelines for Textile Manufacturing, 2007.
EPA WaterSense at Work: Water Quality Considerations, May 2025.

Discussion0
Loading the discussion…