
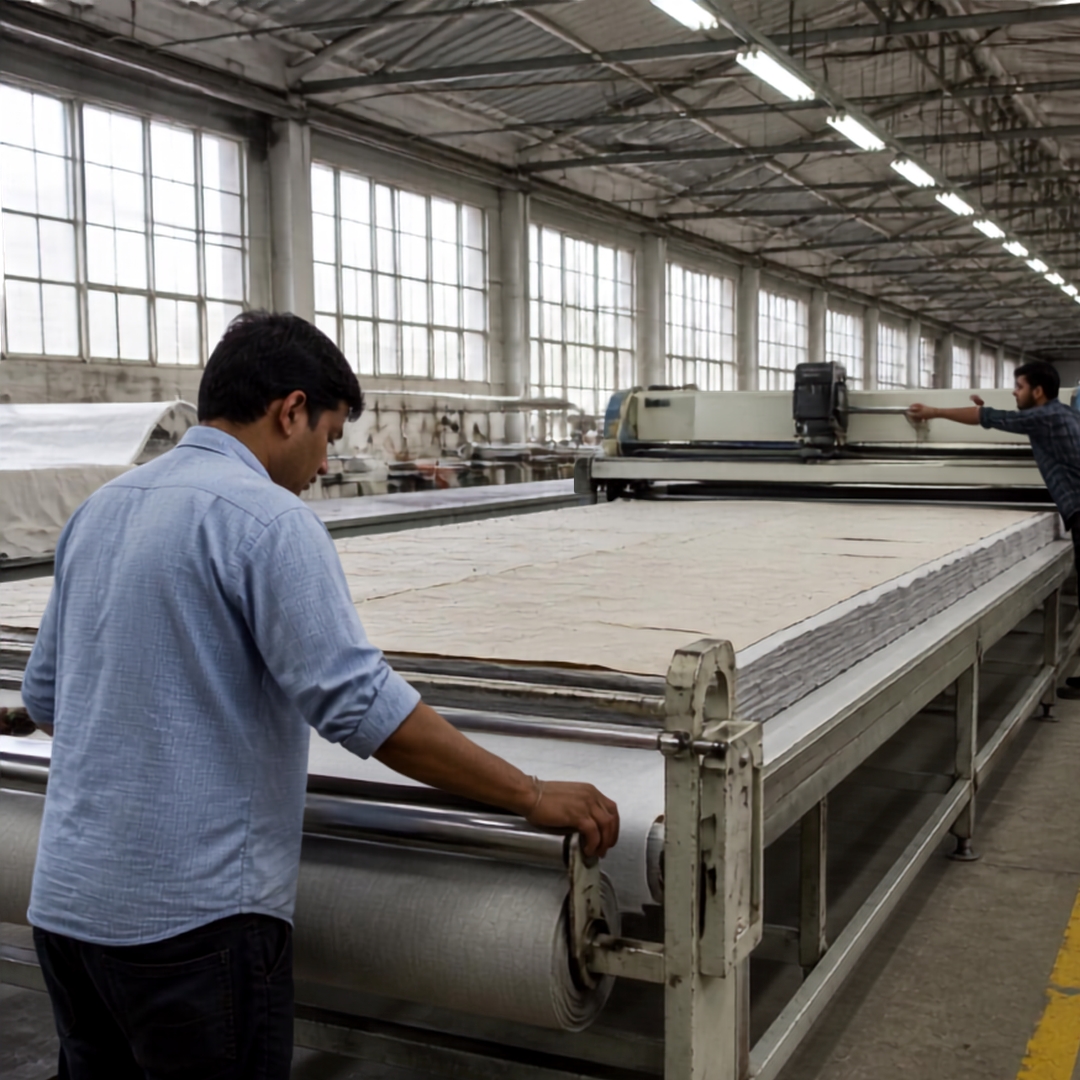
The CAD report says the marker is 84.6% efficient. Everyone signs it. Six weeks later the order closes, the fabric reconciliation lands, and consumption is 4.1% above the costing sheet.
The meeting goes badly, because nobody can point at where the fabric went. The marker was fine. The marker was always fine.
That gap between a good marker and a bad reconciliation is the whole subject of cutting room efficiency, the same stage-by-stage control points laid out in a full walkthrough of the RMG cutting process, and it is where a garment order is won or lost. Fabric is 60 to 70% of the cost of a typical woven garment. Sewing efficiency, the number every factory obsesses over, moves a much smaller pot.
A point of sewing efficiency takes months of method work and training. A point of marker efficiency takes a planner twenty minutes and costs nothing. Most factories audit the first and assume the second.
Cutting room efficiency is the cheapest unclaimed margin on the floor, and it stays unclaimed because it is measured with the wrong number.
Why marker efficiency and fabric utilisation are different numbers
Marker efficiency is a geometry statement about a piece of paper: how much of the marker rectangle is covered by pattern pieces.
Marker efficiency = (Area of all pattern pieces / Total marker area) x 100

Fabric consumption per garment = Marker length x Fabric width x GSM
                                 / (Pieces in marker x 1000)   [kg]
The complement (100 minus efficiency) is waste, and it splits into three parts that need three different fixes: interlocking loss between pieces, end loss at the marker ends, and edge loss at the selvedge.
Fabric utilisation is a warehouse statement: fabric issued against garments produced. It includes everything the marker never sees: end loss on every ply, splice overlaps, roll remnants, fault cut-outs, shade-band re-cuts and mis-cut bundles.
A factory can run 85% marker efficiency and 78% fabric utilisation, and the seven points between them never appear on a single report. That is where the 4.1% overconsumption lives. Quote marker efficiency to the CAD team, fabric utilisation to finance. Never let one stand in for the other.
What is one point of marker efficiency actually worth?
Take a realistic order: 20,000 garments, 1.4 metres of fabric each, at 3.20 per metre, for 89,600 in fabric on one purchase order.
Gain | Per order (20,000 pcs) | Per year (40 orders) |
|---|---|---|
1 point marker efficiency | ~875 | ~35,000 |
2 points marker efficiency | ~1,750 | ~70,000 |
1% fabric utilisation (all sources) | ~896 | ~35,800 |
Compare that with the cost of getting it wrong. One shade-band error forcing a re-cut of 400 garments at 1.4 metres is 1,792 in fabric alone, before sewing and delivery consequences.
Field note: a woven bottoms unit in Chattogram was running 82–83% marker efficiency on a five-pocket style and could not explain a persistent 3% overconsumption. The lays were 180 plies on a 6.2-metre marker. End loss was measured at 3.5 cm each end: 7 cm per ply, 12.6 metres per lay, 1.13% of the fabric on the table, before a single pattern piece was considered. Rebuilding the same order onto 11.4-metre markers with a four-size ratio cut end loss to 0.61% of fabric and lifted marker efficiency to 85.1%. Nothing was bought. The planner changed the marker length and the size combination.
The five levers, in order of return
1. Marker length and size ratio
A marker containing more size sets nests better, because small pieces from one size fill gaps left by another. Going from a two-size to a four-size marker typically gains 1.5 to 3 points of efficiency.
Longer markers also dilute end loss, the point most planners miss. End loss is a fixed centimetre cost per ply, so its percentage impact falls as the marker lengthens:
Marker length | End loss at 3 cm each end | As % of fabric |
|---|---|---|
6 m | 6 cm per ply | 1.00% |
9 m | 6 cm per ply | 0.67% |
12 m | 6 cm per ply | 0.50% |
Lay length buys fabric. Ply height buys labour. They are different decisions and should be argued separately.
2. Ply height versus lay length
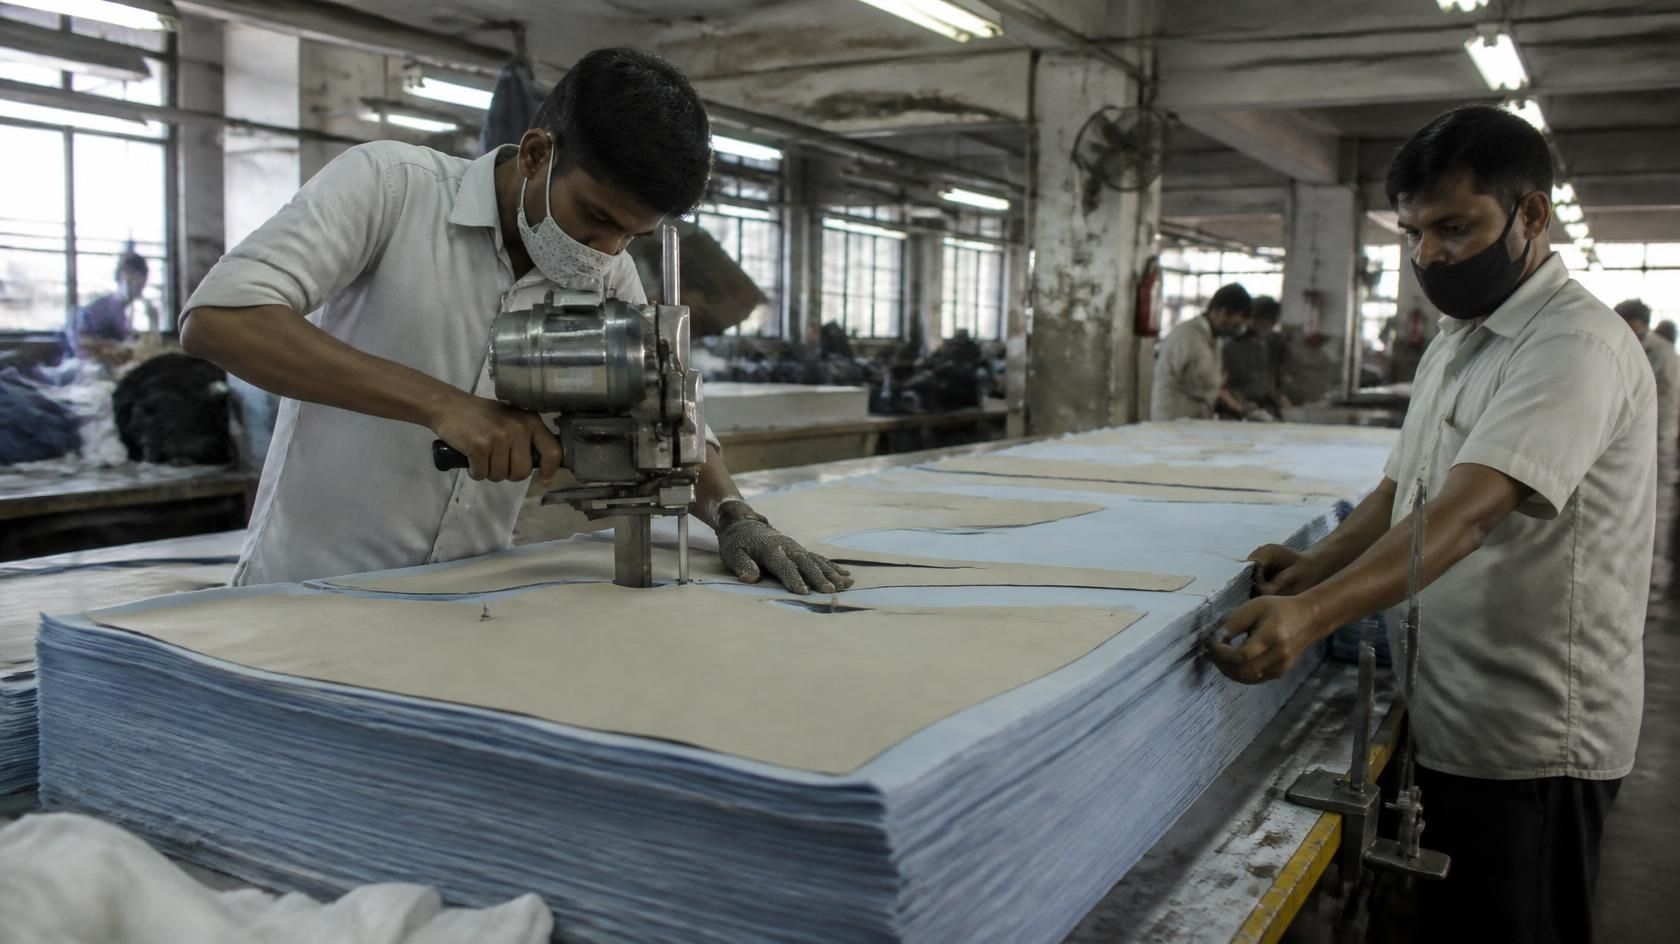
Raising ply height reduces the number of spreads, cutting spreading labour and setup time. It does not reduce end loss at all, because end loss is incurred per ply, so a 200-ply spread with 3 cm each end loses 12 metres before cutting begins.
The rule: push lay length to the limit of your table and your size ratio first, then raise ply height to whatever your knife and fabric will tolerate. Raising ply height on a short marker optimises the cheap variable.
3. Fabric width utilisation
Markers are planned to a nominal width, but fabric arrives with variation. Plan to the minimum width in the lot, measured on arrival, not the supplier's stated width. Then sort rolls into width bands and make a marker per band. Two or three width-band markers recover most of what a single nominal-width marker gives away.
4. Grain and tilt tolerance
A small permitted tilt on non-critical pieces, typically 1 to 2 degrees on pocket bags and facings, gains efficiency with no visible quality effect. It must be agreed with the buyer and recorded in the tech pack or marker approval.
5. Splicing discipline
Splice points cost fabric. Each adds an overlap of typically 2 to 5 cm across the full width. Minimise them by planning splice positions where the marker naturally has a full-width cut line, and sequencing rolls so roll changes fall near those positions rather than at random.
Where does the fabric actually go?
Percentages are of fabric issued, and the ranges are what a competently run woven unit shows before improvement work.
Loss source | Typical range | Countermeasure |
|---|---|---|
Interlocking loss (inside the marker) | 8–18% of marker area | Multi-size markers, agreed tilt tolerance, CAD nesting review |
End loss | 0.5–1.5% | Automatic end cutter, correct catcher setting, longer markers |
Edge / selvedge loss | 0.5–2.0% | Plan to minimum lot width, sort rolls into width bands |
Splice loss | 0.3–1.0% | Roll sequencing to reduce splice count |
Leftover / remnant roll ends | 1–3% of roll | Remnant marker for small parts and trims |
Fabric fault cut-out | 0.5–2.0% | Four-point inspection at receipt, claim on supplier |
Shade band mis-allocation and re-cut | 0.3–1.5% | Roll-to-lay shade mapping before spreading |
Add the middle of those ranges and 4 to 6% of issued fabric is lost outside the marker. That is the gap between marker efficiency and fabric utilisation, itemised.
How shade bands and roll allocation break a good marker
A perfect marker cut across three shade bands produces garments whose panels do not match. The fabric is not wasted in the cutting room but in the finishing audit, which is worse because the labour is already in it.
Shade group the rolls before you build the lay plan. Each lay draws from one shade band, and the roll-to-lay allocation is written down before spreading, not decided by whoever hands the next roll to the spreader. Where a band is short, cut the whole size range from it rather than splitting a size across bands.
Roll allocation is a fabric decision disguised as a paperwork task. Treat it with the same discipline as the marker itself.
What should the cutting room measure daily?
Marker efficiency per style, straight from the CAD system: the geometry number.
Actual versus planned consumption per order, in kilograms: the reality number that catches every loss the marker hides.
Cutting room output in pieces per operator hour, benchmarked the same way a standard minute value calculation prices sewing labour, so fabric gains are not quietly bought with unacceptable labour.
The third matters more than people expect. It is easy to save 1% of fabric by slowing the room 15%, and a factory that paces cutting to sewing consumption with a kanban pull system between cutting and sewing, and costs labour properly, sees that trade immediately.
The cutting room efficiency audit checklist
Marker planned to measured minimum width of the lot, not nominal width
Rolls sorted into width bands, with a marker per band
Three or more sizes in the marker where the ratio allows
Marker length within 90% of usable table length
End loss measured this week, recorded in cm, both ends, per lay
Splice count per lay planned in advance, positions marked
Tilt tolerance has written buyer approval on file
Shade band mapped to lay, roll allocation sheet signed before spread
Remnant marker in use for small parts
Actual vs planned consumption closed per order, in kg, within 1%
Each failing item is worth 0.3 to 2 points of fabric. Most factories fail four of the twelve on any given day.
Final Word
The cutting room is the last place where a twenty-minute decision still changes the cost of every garment in the order. After the knife goes through, fabric cost is fixed and everything downstream is damage control.
Sewing gets the attention because it is loud, visible and full of people. Marker planning gets a signature and a filed report. Reverse that.
Give the marker the argument, the second opinion and the audit, put those numbers on a properly built factory KPI dashboard, and give every reconciliation a named owner. The two per cent you find there pays the rent.

Discussion0
Loading the discussion…