
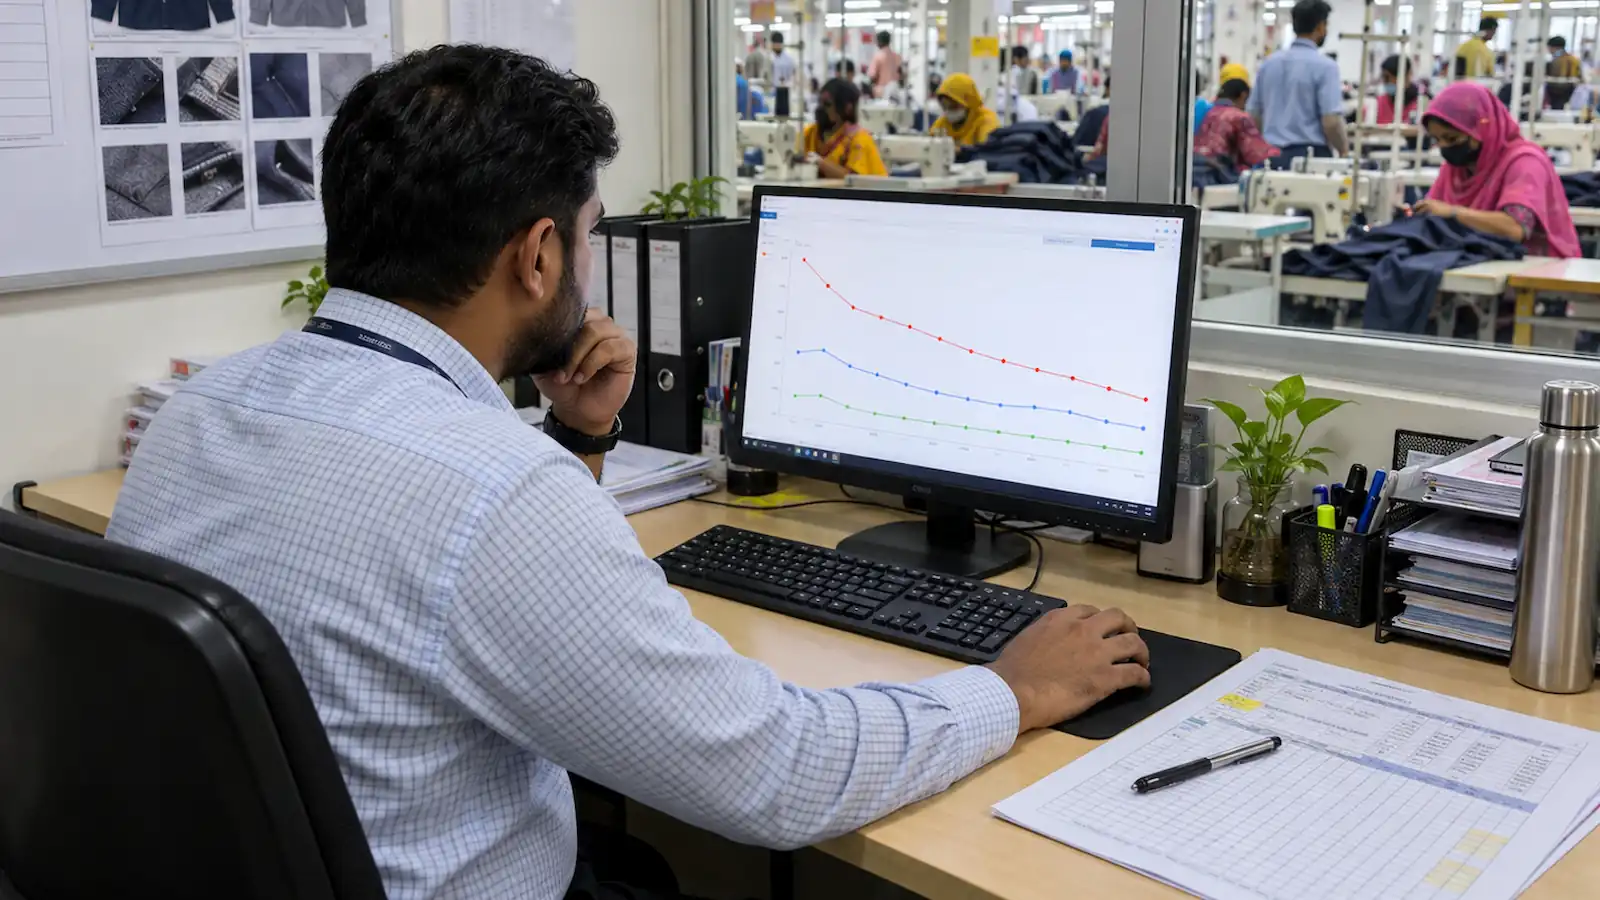
A quality manager used to be able to walk into a morning meeting and say "we had a rough day yesterday, quite a few defects." Nobody challenges that sentence, and nobody can act on it either. A global buyer, and increasingly a factory's own management, wants a number instead of a mood. In Bangladesh's RMG sector, that number has a name: DHU, defects per hundred units.
What DHU Actually Counts
The formula is simple, but the detail inside it is where most people get it wrong:
DHU = (Total number of defects found / Total number of garments inspected) x 100The part worth slowing down on: DHU counts total defects, not total defective garments. If an inspector checks 250 garments and finds 35 individual defects spread across 20 defective pieces, some pieces having two or three defects each, DHU uses the 35, not the 20.
DHU = (35 / 250) x 100 = 14That is meaningfully different from a simple percent-defective figure, which would have used 20 defective pieces out of 250 and arrived at 8 percent. Both numbers are real and both are useful, but they answer different questions. Percent defective tells you how many garments a customer could reject. DHU tells you how much total defect work your finishing and rework stations are actually carrying, which is why factories that track only percent defective often get blindsided by a rework backlog that a slightly higher DHU would have warned them about weeks earlier.
Why DHU Is Treated as a Profitability Number, Not Just a Quality One
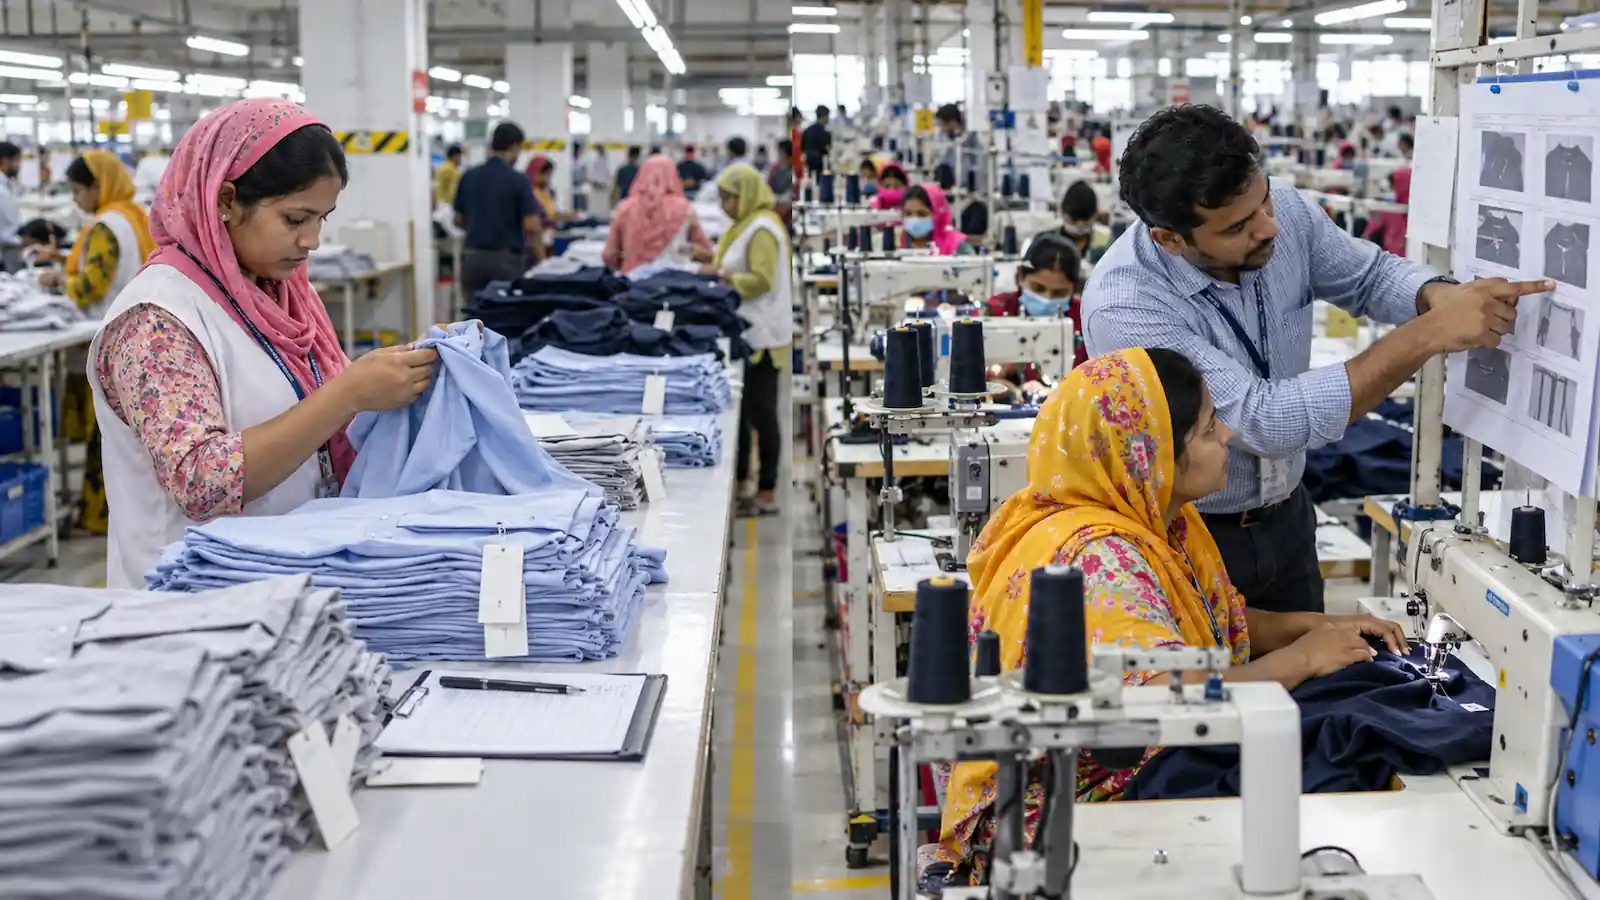
Every defect that DHU counts has to go somewhere before the garment ships: back to a repair station, back through pressing and re-inspection, sometimes back through washing. Each pass costs real sewing and finishing minutes on top of the minutes already spent making the garment once. That direct link to labor cost is exactly what the site's own SMV and CM cost calculator is built to quantify: rework is not free capacity being used up, it is minutes that were already priced into the day's output target, now spent twice.
This is also why DHU is tracked daily rather than only at final audit time. A rising DHU trend, read against a well-designed factory KPI dashboard, tells management exactly where to look before a small problem becomes an entire shipment's rework bill: is it concentrated in one line, one operation, one fabric batch, or did it start the day a new operator joined a station without enough training on that specific seam.
Reading a DHU Number: Industry Benchmark Ranges
DHU targets genuinely vary by garment complexity; a basic T-shirt and a tailored jacket are not held to the same bar. As a general, publicly referenced benchmark scale used across the quality and ERP consulting industry, DHU is commonly read this way:
DHU range | General reading |
|---|---|
Under 5 | Excellent; most lots move straight to shipment with minimal rework |
5 to 10 | Good; typical of an established factory with a mature QC system |
10 to 15 | Acceptable; common for newer factories or more complex, detail-heavy garments |
15 to 25 | Poor; rework is now visibly eating into margin, and buyers start to notice |
Above 25 | Critical; lot rejection becomes routine and the numbers stop being a warning sign and start being a crisis |
These ranges are a general industry reference point, not a rule any single buyer enforces identically, so a factory's own trend line, compared against its own history, still matters more than chasing someone else's benchmark.
Worked Example: Finding the Bottleneck, Not Just the Number
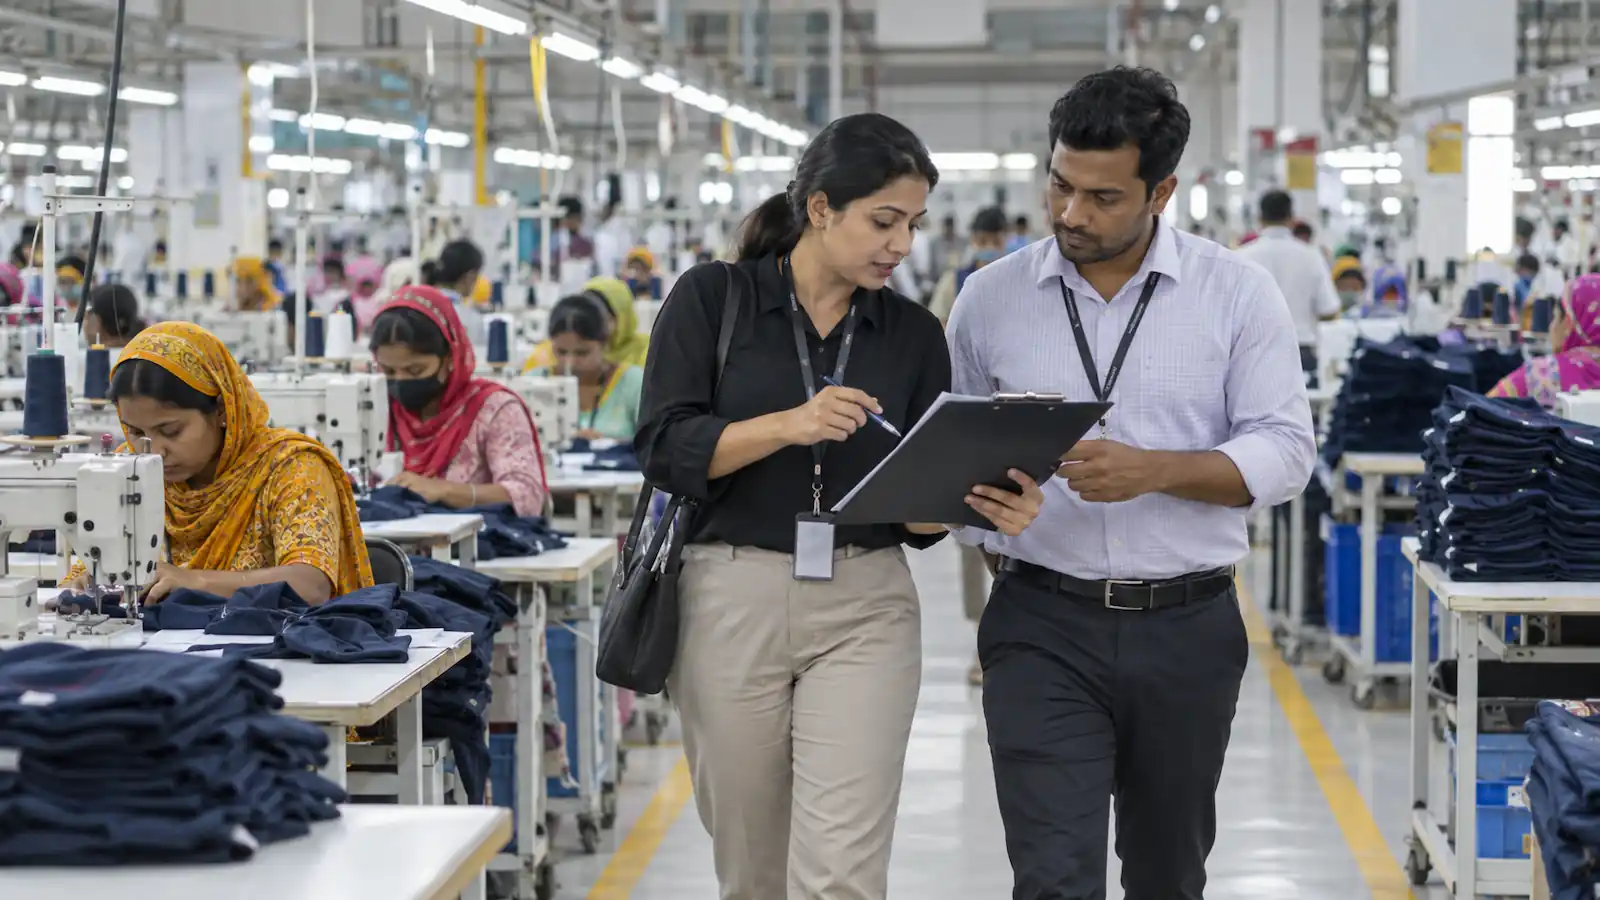
A finishing floor reports a DHU of 12 for the week, sitting in the "acceptable" range but trending upward from 8 the week before. Rather than stopping at the headline number, the quality team breaks it down by stage, the same instinct behind statistical process control, which insists a single average number always hides more than it reveals.
Stage | Defects found | Share of total |
|---|---|---|
Cutting related (pattern, marker, ply defects) | 6 | 10% |
Sewing related (seam, stitch, measurement) | 38 | 63% |
Finishing related (pressing, packing, labeling) | 16 | 27% |
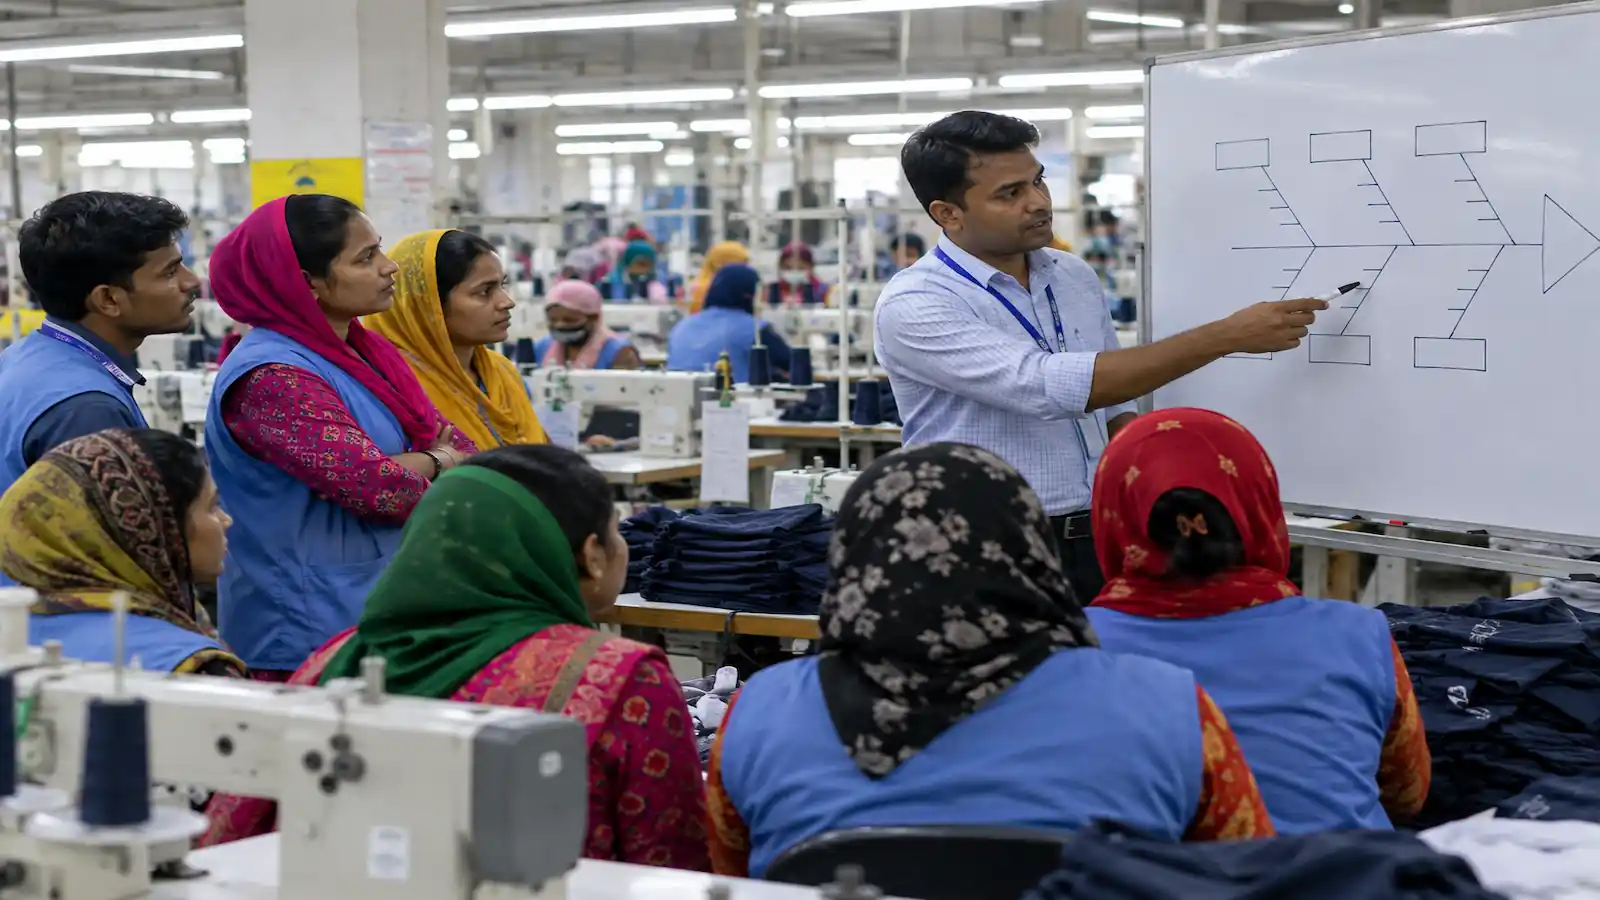
Almost two-thirds of the week's defect load traces back to sewing, not finishing, even though finishing is where the DHU number was actually measured. That single breakdown redirects the whole corrective action: instead of adding more finishing inspectors, the real fix is a targeted retraining session on the specific seam operation driving most of that 63 percent, closer to where the trouble is being created, echoing the same cutting-to-sewing handoff discipline covered in the Kanban pull system guide and the lay-planning precision in the RMG cutting process.
DHU Tracking Checklist
DHU calculated from total defects found, not total defective garments, so multi-defect pieces are counted correctly
DHU tracked daily by line and by stage (cutting, sewing, finishing), not only as one factory-wide weekly average
A rising trend triggers a stage-level breakdown before any corrective action is decided, not after
Rework minutes are costed using the same SMV and CM logic as regular production, not treated as free or invisible labor
DHU benchmark used is matched to garment complexity, not a single number applied to every style
Final Word
DHU looks like a small number on a whiteboard, but it is really a live readout of how much invisible cost is moving through a factory's rework stations every single day. Read it correctly, defects divided by units inspected, broken down by stage rather than left as one average, and it stops being a quality report card and starts being what the best-run factories already treat it as: an early warning system for margin, not just for shirts.
In Part 4, we look at how a factory actually moves its DHU down over time, the campaigns, the line-stop authority, and the root-cause habits that turn a good quality number into a lasting one.
Discussion0
Loading the discussion…