
A generator trips at 11pm during a shipment week. The maintenance manager pulls the log and finds the last scheduled service was done on time, three weeks ago, per the annual calendar. Nothing on the checklist caught it. Meanwhile, two floors up, a sewing machine that has never once failed is getting a full teardown this Friday because the schedule says so.
This is what happens when a plant buys one maintenance strategy for the whole factory instead of matching the strategy to the asset. The debate over preventive vs predictive maintenance is usually framed as a choice: pick the modern one, buy the sensors, retire the calendar. That framing is wrong for most apparel and textile plants. The honest answer is that most of your assets do not justify predictive monitoring at all, and a disciplined preventive programme, run by people who actually do the tasks on schedule, beats a half-implemented predictive one every time.
The Four Maintenance Strategies, and What Each One Actually Suits
There are four strategies, not two. Treating this as a preventive vs predictive maintenance binary is the first mistake.
Run-to-failure (reactive): deliberate, not negligent. Correct when failure consequence is low, the part is cheap and stocked, and repair is fast.
Preventive (time or usage based): service or replace at a fixed interval regardless of condition. Correct only where a genuine wear-out pattern exists with an identifiable useful life: belts, filters, seals, brake linings, lubricant.
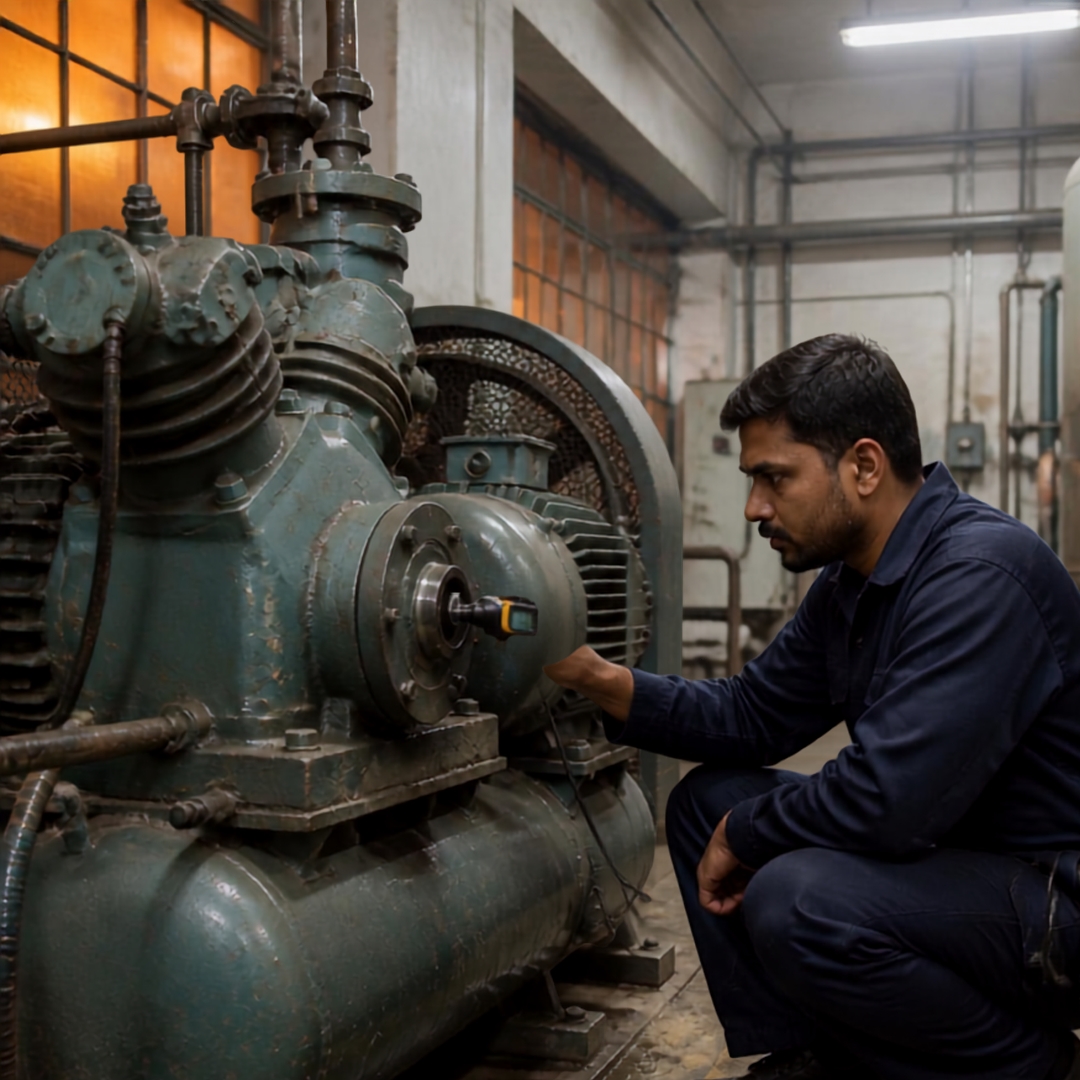
Predictive (condition based): monitor a measurable parameter and act on the trend, not the calendar. Correct when a detectable degradation signal exists early enough to plan a repair before functional failure: see our guide to pneumatic circuits and the real cost of compressed air for what that looks like on a compressor.
Reliability-centred (detective/RCM): periodic function testing of protective devices that sit dormant until needed: safety valves, trip circuits, standby pumps, fire alarms, the kind of assets a formal hazard identification and risk assessment exercise typically flags first. They either work when tested or they do not.
Strategy | Best asset profile | Typical apparel/textile examples |
|---|---|---|
Run-to-failure | Low consequence, cheap, redundant, fast to fix | Sewing machine needle plates, small idler pulleys, non-critical fans |
Preventive | Confirmed wear-out mode, predictable life | Sewing machine servicing, belt and filter changes, gearbox oil changes |
Predictive | Detectable degradation signal, long enough P-F interval, consequence justifies the cost | Compressors, boilers, dyeing machine pumps, generators, chillers |
Reliability-centred / detective | Protective device, dormant, safety or compliance critical | Fire pumps, pressure relief valves, emergency stop circuits, standby generators |
How to Decide, Asset by Asset: Criticality, Failure Mode, Consequence
The real preventive vs predictive maintenance decision is not made at plant level. Score every asset on three axes and multiply them, rather than debating strategy in the abstract.
Consequence of failure: safety risk, quality impact, production stoppage, and repair cost, scored together.
Probability of failure: pulled from your own failure history, not a vendor's generic MTBF number.
Detectability: whether a measurable parameter degrades ahead of the failure with enough lead time to act.
Rank the result. In a typical plant, 15 to 20 per cent of assets account for roughly 80 per cent of downtime cost, those are the candidates for condition monitoring and a proper RCM review. The bottom half of the list gets run-to-failure with a documented spares policy (sized with the same queuing theory approach to buffer sizing used for WIP buffers on the line), deliberately, in writing, so nobody mistakes the absence of a PM task for an oversight.
This is also where the age-related failure assumption falls apart. Classical reliability studies across several industries found that only about 11 per cent of failure modes are genuinely age-related: the rest show random or infant-mortality patterns. The practical consequence is blunt: scheduled overhaul of a complex assembly often makes reliability worse, because reassembly introduces new defects.
Field note: A denim finishing unit ran full annual overhauls on all six compressors regardless of running hours or condition. After a criticality review, three compressors (feeding non-critical air tools) moved to run-to-failure with spares on the shelf. The other three, feeding the dye-house pressure system, got vibration monitoring instead of teardown. Downtime hours from compressor failures fell by 34 per cent over the following year, and the annual overhaul spend dropped by roughly 40 per cent, because two of the three "critical" units did not actually need a full strip-down, only a bearing change the vibration trend had already flagged, the kind of failure covered in our guide to bearing selection, fits and failure diagnosis.
What Is the P-F Curve, and Why It Decides If Prediction Is Even Possible
Every preventive vs predictive maintenance argument eventually comes down to one number. P-F is the interval between the point a failure becomes detectable (P, potential failure) and the point of functional failure (F). This single number decides whether condition monitoring is even physically achievable on a given asset, not whether you can afford the sensor.
Your inspection frequency must be at most half the P-F interval, or you will miss failures between checks. If a technique's P-F interval is shorter than your realistic response time (detect, plan, source parts, schedule the repair), it produces alarms nobody can act on. That trains your team to ignore alerts, which is worse than not monitoring at all.
Technique | Typical P-F interval | Implied inspection frequency |
|---|---|---|
Vibration analysis (bearings) | 1-9 months | Monthly |
Oil analysis (gearboxes) | 1-6 months | Monthly to quarterly |
Thermography (electrical panels) | 1-6 months | Quarterly |
Ultrasound (leaks, early bearing wear) | 2-12 months | Monthly |
Motor current signature analysis | 1-6 months | Monthly to quarterly |
Audible noise / human senses (operator care) | Days to weeks | Every shift |
Notice the last row. Operator senses have a short P-F interval and a near-zero cost of inspection, which is exactly why autonomous maintenance (daily cleaning, inspection, and lubrication by the operator) routinely catches things a monthly vibration route would miss between visits.
Which Assets in a Garment or Textile Plant Actually Warrant This
Applied to a real factory floor, preventive vs predictive maintenance sorts itself out fast. Most apparel manufacturing floors do not need, and cannot justify, a condition-monitoring programme covering everything with a motor.
Genuinely worth condition monitoring: air compressors (plant-wide air loss on failure, bearing and valve wear detectable), boilers (safety-critical, thermography and water treatment monitoring both apply), dyeing machine pumps (mechanical seal and bearing failure detectable via vibration, batch loss on failure is expensive), generators (business-continuity critical, load-bank testing and vibration both apply), and chillers (process-critical for dyeing and finishing temperature control).
Not worth it, in the overwhelming majority of cases: the hundreds of sewing machines on a typical floor. Each unit is cheap relative to the analyst hours it would take to monitor it, failure consequence is a single line stopping for minutes, and a scheduled servicing calendar plus daily operator checks catches nearly everything that goes wrong with a sewing head. This is preventive-and-operator-care territory, not predictive territory.
The Metrics That Tell You the Programme Works
Activity metrics (PM tasks closed, work orders raised) tell you people are busy. These tell you whether the programme is actually paying back.
Metric | Formula | Healthy target |
|---|---|---|
Planned maintenance percentage | Planned hours ÷ total maintenance hours | Above 75% |
Schedule compliance | PM tasks done on time ÷ scheduled | Above 90% |
MTBF | Operating time ÷ number of failures | Rising, asset by asset |
MTTR | Repair time ÷ number of repairs | Falling |
PM find rate | PMs that discover a real defect ÷ total PMs | 10-30% |
PM find rate is the most underused number on this list. Below 10 per cent, your interval is too short: you are paying labour to confirm machines are fine. Above 30 per cent, it is too long: you are catching failures late. Track it per asset class, not as a plant-wide average, or you will hide both problems inside a comfortable mean.
The Blunt Part: A Predictive Programme Nobody Acts On Is Worse Than Reactive Maintenance
A vibration route that generates a monthly report nobody reads costs more than doing nothing, because you are paying for the instrument, the analyst hours, and the false sense that the asset is covered, while the failure still happens, on schedule, because the alert sat unread.
Preventive vs predictive maintenance is not a technology upgrade decision: it is a discipline decision. A plant that runs a boring, well-executed preventive calendar on its critical assets, backed by daily operator checks, will outperform a plant that bought vibration sensors for twelve compressors and reviews the data quarterly. The instrument is not the programme. The closed loop (data reviewed, work order raised, work order closed, trend re-checked) is the programme.
Quick-Reference Checklist Before You Commit to a Strategy
Question | If yes | If no |
|---|---|---|
Is failure consequence high (safety, quality, output)? | Consider predictive or RCM | Run-to-failure is likely correct |
Is there a confirmed wear-out mode with known useful life? | Preventive, fixed interval | Time-based service will waste life or miss random failures |
Does a measurable degradation signal exist? | Predictive is technically possible | Predictive is not possible regardless of budget |
Is the P-F interval longer than 2x your response time? | Predictive is workable | Shorten scope or accept preventive |
Will someone actually review the data and act on it weekly? | Proceed with the instrument | Fix the process before buying the sensor |
Is this a dormant safety device? | Detective/RCM function testing, mandatory | N/A |
Final Word
Stop asking whether your plant should run preventive vs predictive maintenance as a blanket policy. Ask, asset by asset, what the failure mode actually looks like, whether you can detect it early enough to matter, and whether anyone will act on what you find. Most of your factory (the sewing floor, the finishing lines, the material handling) is preventive-and-operator-care territory, and that is not a compromise. It is the correct engineering answer for machines with short consequence and long service records. Save the instruments for the compressors, boilers, dyeing pumps, generators, and chillers where the P-F interval and the consequence both justify the spend, and then make sure someone reads the report.



Discussion0
Loading the discussion…