

A buyer in Europe places an order on a Tuesday morning. By Tuesday afternoon in Dhaka, a merchandiser has booked the fabric, a planner has slotted it against next month's capacity, and somewhere down the line a knitting machine is already warming up for a job it does not know exists yet. Multiply that single order by the few hundred a mid-sized factory is juggling at any one time, buyers, colors, sizes, shipment dates, all moving at once, and you start to see why so much of this industry used to run on a mix of memory, phone calls and a spreadsheet nobody fully trusted.
The factories pulling ahead today did not simply work harder than everyone else. They built a habit of watching two things closely, all the time, instead of finding out too late: the commercial side of the business, and the production side, with a planning function standing between them checking that the two stay honest with each other. This is where that story starts, with the side that faces outward, toward the buyer.
The Commercial Nerve Center
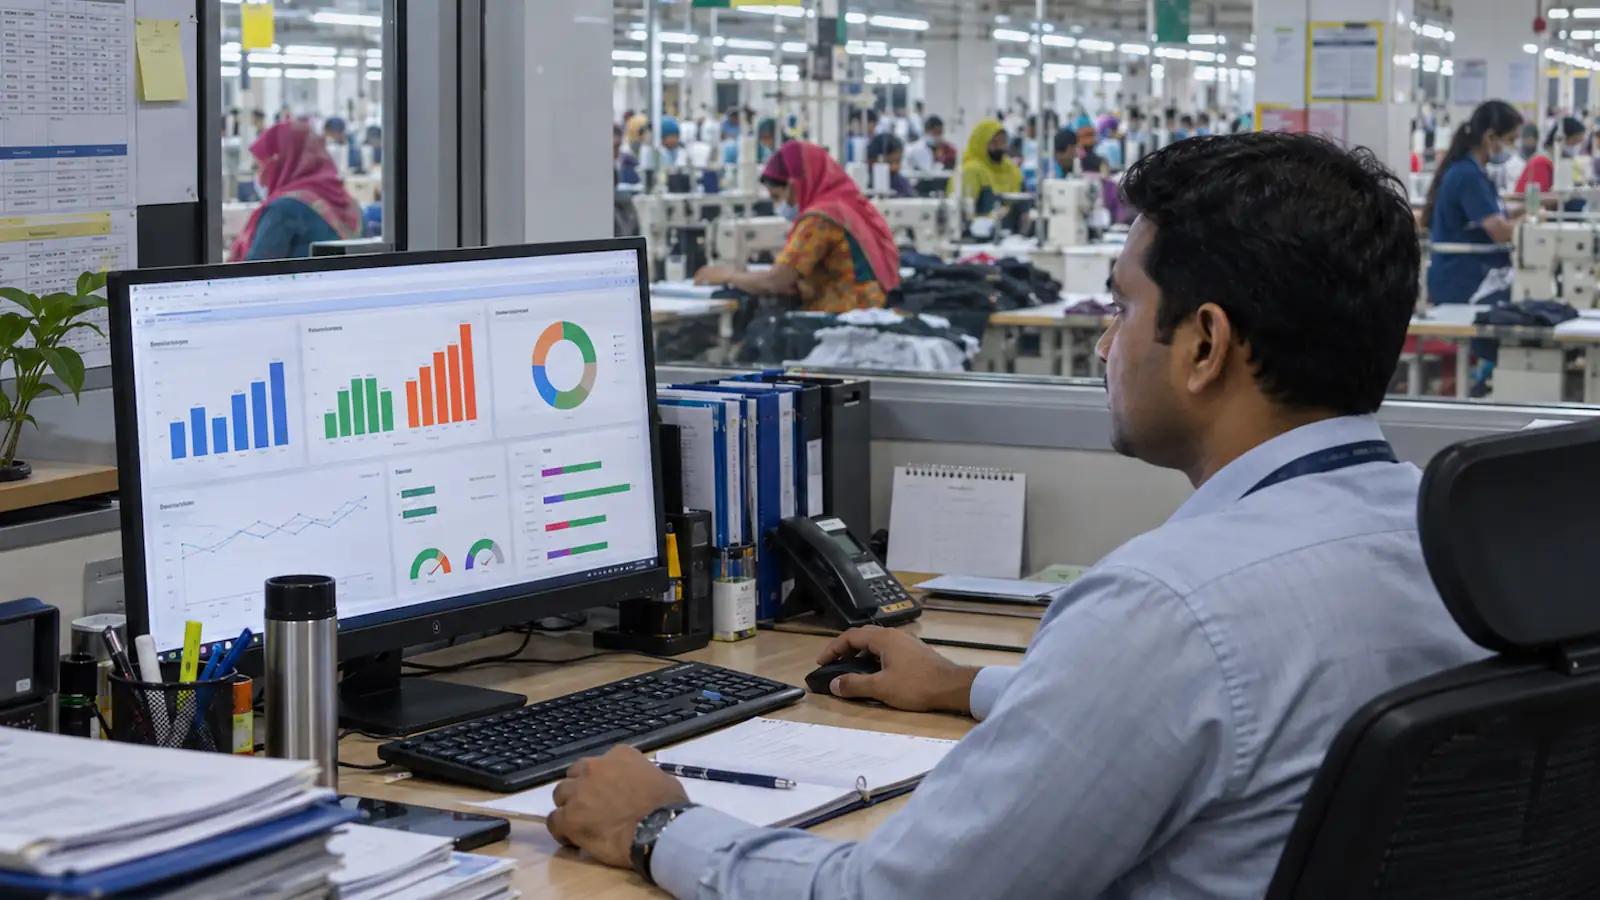
Think of a supply chain KPI dashboard as the part of the business that does not care yet how a garment gets sewn. It cares about a narrower, sharper question: are we bringing in the business we said we would, and are we keeping the promises we already made. Three numbers carry almost all of that weight.
1. Are We Hitting the Sales Target?
A sales target is not picked out of thin air. It usually starts from the previous year's real numbers, broken down by buyer, by product, and by the SMV each product actually takes to make, so the company can see which buyers and which products it is genuinely good at running, and where it wants to put more effort next year. That review turns into one fiscal year sales target for the company as a whole. From there, the target gets split further: each production plant confirms how much SAH capacity it can offer, month by month, and that monthly capacity is what gets assigned to each sales head as their own number to hit. The dashboard's job is blunt and useful: show, in real time, how much confirmed order value has actually come in against that monthly number, sales head by sales head, so a small gap is caught this week instead of only showing up as one big gap when the whole year is added up at the end.
2. Did the Materials Actually Arrive on Time?
A factory cannot produce what has not arrived. Fabric, yarn, trims and accessories each carry their own lead time, and a delay on any one of them is a quiet countdown that nobody hears until it is loud. Tracking material receipt against the promised date, at the line item level rather than the whole purchase order, is what turns a supplier's delay into an early warning instead of a shipment-week surprise. This is exactly why ABC-XYZ inventory segmentation matters upstream of the dashboard: a high-value, unpredictable trim deserves a tighter delivery watch than a cheap, steady one. The reorder policy behind that watch, covered in EOQ versus periodic review, is what decides how much warning the dashboard actually gets before a shortage becomes a production stop.
3. Did We Ship When We Promised?
On time delivery, often shortened to OTD, is the number a buyer actually remembers a factory by, more than almost any other. It is the share of orders shipped on or before the date the factory itself committed to. Manufacturers across many industries commonly treat a rate in the mid-90s percent as a strong, world-class target, though the real number that matters is whatever a specific buyer's contract and patience actually require, not a borrowed benchmark from somewhere else.
What it tracks | The real question behind it | What good looks like |
|---|---|---|
Order intake vs target | Are we winning the business we planned for, this week, not just this quarter | A live, updating gap, not a surprise at month close |
On time material receipt | Will production actually have what it needs, when it needs it | Tracked per material line, not per purchase order as a whole |
On time delivery (OTD) | Are we keeping the promise we already made to the buyer | A trend the factory can explain, not just a single lagging percentage |
The Standard Dashboards a Supply Chain Team Actually Needs
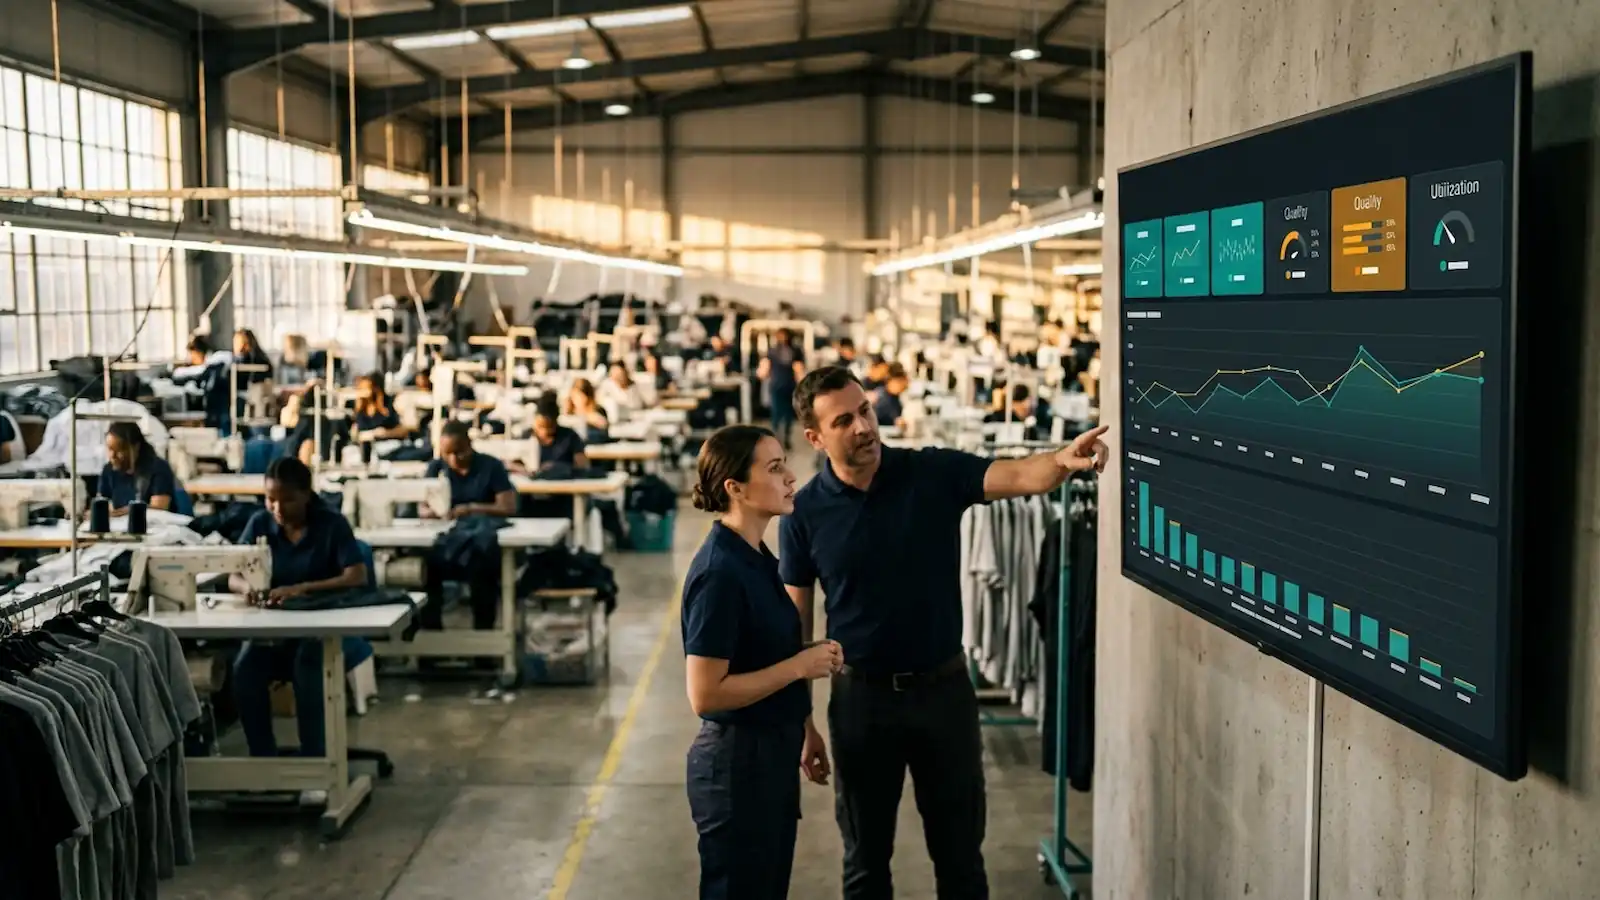
"Supply chain dashboard" is not one screen. In practice it is a small set of standard views, each one answering a different question, and each one used by a different person on a different schedule.
Dashboard | What it shows | Who checks it daily |
|---|---|---|
Order book / sales order status | Every confirmed order's current stage, booked, in production, ready to ship, shipped, updated as it happens rather than typed in after the fact | Merchandiser, sales head |
Sales target vs achievement | Confirmed order value against the monthly and yearly target, broken down by sales head and by buyer | Sales head, sales management |
Material inward / procurement tracking | Fabric, yarn, trims and accessories tracked line by line against the date each one was promised, not the whole purchase order as one block | Merchandiser, procurement team |
On time delivery / shipment performance | Orders shipped on or before the promised date, shown as a trend, with any still-open shipment flagged by how close it is to its date | Sales head, planning, senior management |
Buyer scorecard | Order value, on time delivery rate and quality rating for each buyer, side by side, usually pulled up at every buyer review meeting | Sales head, senior management |
Capacity and booking (tied to Central Planning) | Booked, forecast and open capacity by plant and by month, so a new order can be checked before it is promised, not after | Central Planning, sales head |
Inventory and merchandiser liability | Material booked, received, used and left in hand by material type, finished garment stock and leftover, and a style-wise liability figure once an order ships or is cancelled | Merchandiser, store/inventory team, finance |
The inventory and liability dashboard usually carries more moving parts than any other on this list, because a single style passes through several distinct stock states before its position is finally settled.
Stage tracked | What it actually shows |
|---|---|
Material booked | Fabric, trims and accessories booked against the confirmed order's BOM, including the agreed wastage allowance |
Material received | What has actually arrived against what was booked, by material type, so a shortfall shows up before it becomes a cutting problem |
Material used | Actual consumption recorded during cutting and sewing, checked against the BOM's planned consumption |
Material in hand | Received minus used, the real stock still sitting against that order or style right now |
Material type-wise leftover | Leftover fabric, trims and accessories once the order is complete, since roll-based and minimum-order-quantity buying almost never lands on an exact zero |
Finished garment stock and leftover | Stitched pieces counted against the shipped quantity, with any excess or short-packed pieces flagged by style |
Style-wise merchandiser liability | Once an order ships or is cancelled, the leftover material and finished-goods position is converted into one liability figure per style, so it is clear whose responsibility that leftover value is and what happens to it next |
Skip that last step and leftover fabric, trims and finished pieces just sit in the store as unexplained stock, with no style attached to explain how it got there and no one clearly responsible for clearing it. A style-wise liability figure is what turns "we have some leftover somewhere" into a specific, assignable number a merchandiser can actually act on.
None of these seven is a nice-to-have add-on. Together they are the minimum set a mid-sized or larger RMG exporter needs to run its commercial side without guessing, and every one of them is only as good as the shared data feeding it.
Where Central Planning Fits Into the Commercial Side
Every one of those three numbers depends on a promise being realistic in the first place, and that is a planning question, not a sales question. Before a sales team confirms an order, Central Planning has to check whether the factory actually has the capacity to deliver it on the date about to be promised.
Most serious planning systems handle this with zones: a near-term zone that is effectively frozen, a middle zone that is still slushy and open to renegotiation, and a further-out zone that is still just a forecast. A new order is matched first against any capacity already reserved for that buyer or style, then re-checked if the confirmed style, quantity or date turns out different from what was planned. If a forecast's own delivery window passes with no real order behind it, that capacity goes back into the pool instead of sitting reserved for an order that never came.
Order intake without a capacity check behind it is just a hopeful number. Central Planning is what turns that hopeful number into one the operations side, covered fully in Part 2, can actually be held to.
Why the Number Alone Is Never Enough
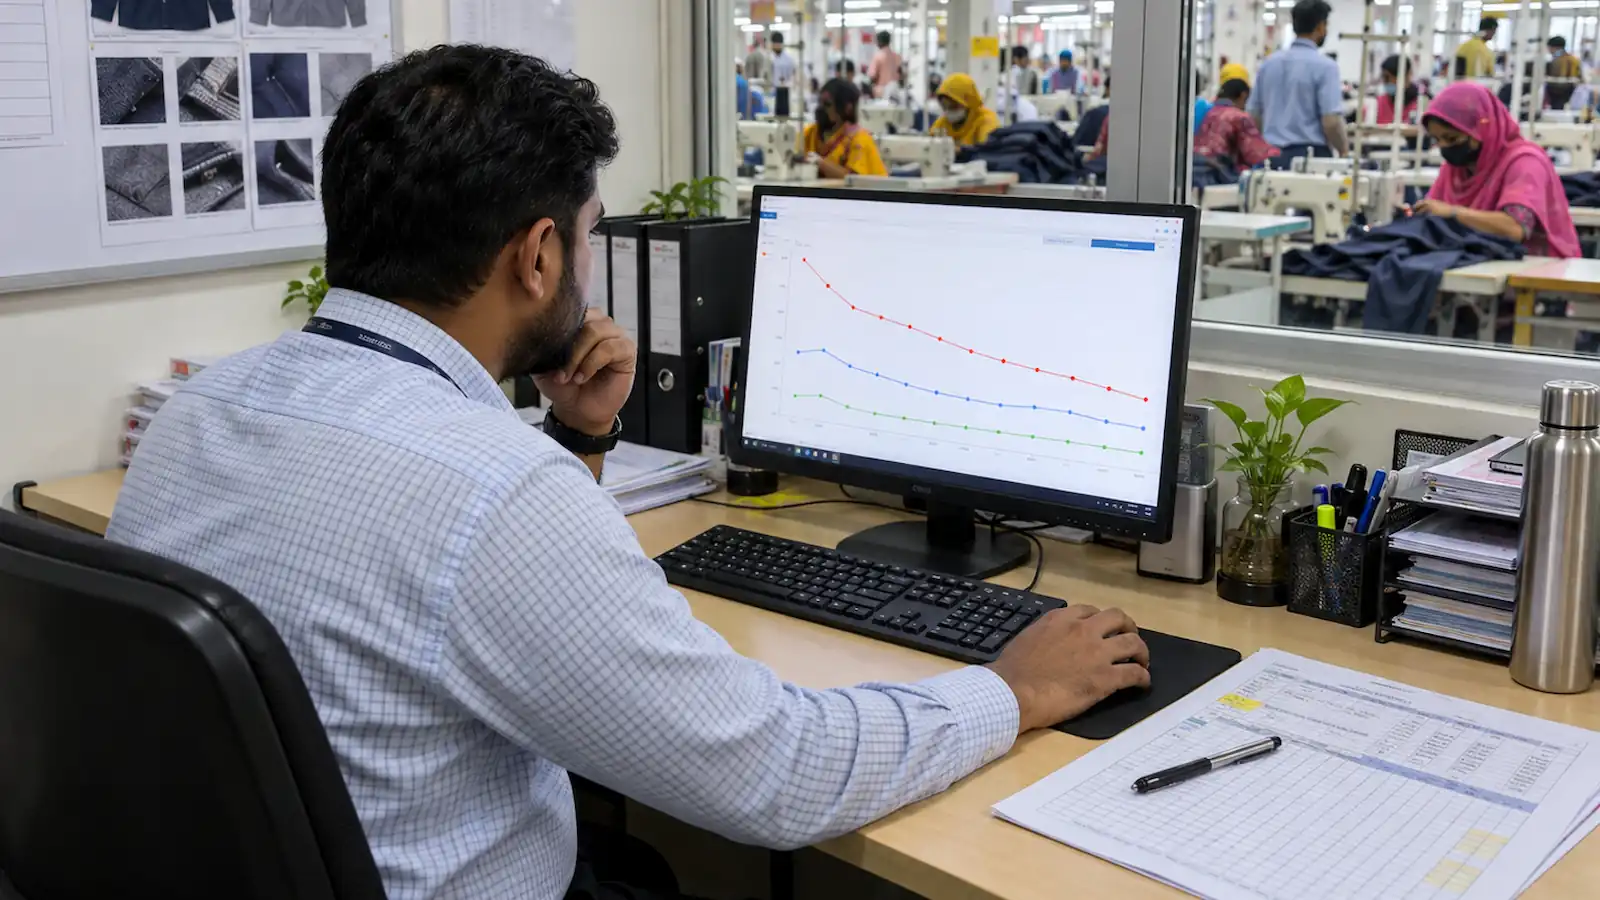
The most dangerous dashboard shows only a single green or red status. A factory shipping 94 percent on time and trending up looks identical, on that one number, to one shipping 94 percent and trending down from 98 last quarter, but they are not in the same position at all.
A good dashboard shows the trend, not just the number, and connects a material delay to the specific orders it threatens before the shipment week arrives, the same instinct behind a properly sized production buffer. That same trust-building logic is what actually shapes a buyer relationship over time, covered in The Buyer's Journey in Bangladesh, Part 2: a clean, honest OTD trend earns a different conversation at the next price negotiation than a promise that things will be better this time.
What Makes This Dashboard Worth Trusting
None of this works if the underlying data is fractured across three different spreadsheets that never quite agree with each other. This is exactly why the seven rules for a KPI dashboard that actually sticks insist on a single source of truth before anything else. A beautifully designed dashboard built on three conflicting exports is still a bad dashboard, just a better-looking one.
The Present Reality for Bangladesh's RMG Exporters
This is not an abstract exercise. Bangladesh still holds a commanding share of the European apparel market, but Vietnam now captures roughly double Bangladesh's share of US apparel imports, largely because its supply chains are faster and its delivery more predictable. Layer on Bangladesh's coming graduation out of least developed country status, which risks new tariffs of up to roughly 12 percent under EU safeguard measures, and a buyer choosing between two similarly priced options will lean toward the one that has never left them guessing about a delivery date. That is exactly the discipline this dashboard exists to prove, and it is quickly becoming a competitive answer, not just good practice.
Supply Chain Dashboard Checklist
Sales target set from the previous year's buyer, product and SMV mix, then broken down into a fiscal year number, and further into monthly, plant-wise SAH capacity for each sales head
Order intake tracked against that monthly sales head number in real time, not only totaled and compared to the yearly target at year end
Every new order matched first against any forecast capacity already reserved for that buyer and style, re-checked if the confirmed style, quantity or date differs from what was planned, and released back into the pool if it stays unconfirmed past its planned date
Material receipt tracked at the line item level, against the date that was actually promised, not the date the order was placed
On time delivery shown as a trend over recent months, not a single current percentage in isolation
The dashboard pulls from one shared source of order and shipment data, not from separate teams' individual spreadsheets
Material booked, received, used and left in hand is tracked by type, not just as one lump inventory figure per order
A style-wise liability figure is generated the moment an order ships or is cancelled, so leftover material and finished goods are never left unassigned in the store
Final Word
A supply chain dashboard does not sew a single stitch, and it does not need to. Its job is to answer one question honestly, all the time: are we bringing in the business we promised, and are we keeping the promises attached to it, with a planning function making sure that promise was realistic before it ever reached the buyer. Get that right, and a factory stops finding out about a problem in the same week it becomes a crisis, and starts competing on reliability at the exact moment reliability is becoming the thing buyers are shopping for.
In Part 2, we go inside the factory floor itself, the efficiency, defect and equipment numbers that make up the operations side of this story, and the fuller picture of how Central Planning and a real ERP system connect both halves together.
Discussion0
Loading the discussion…