
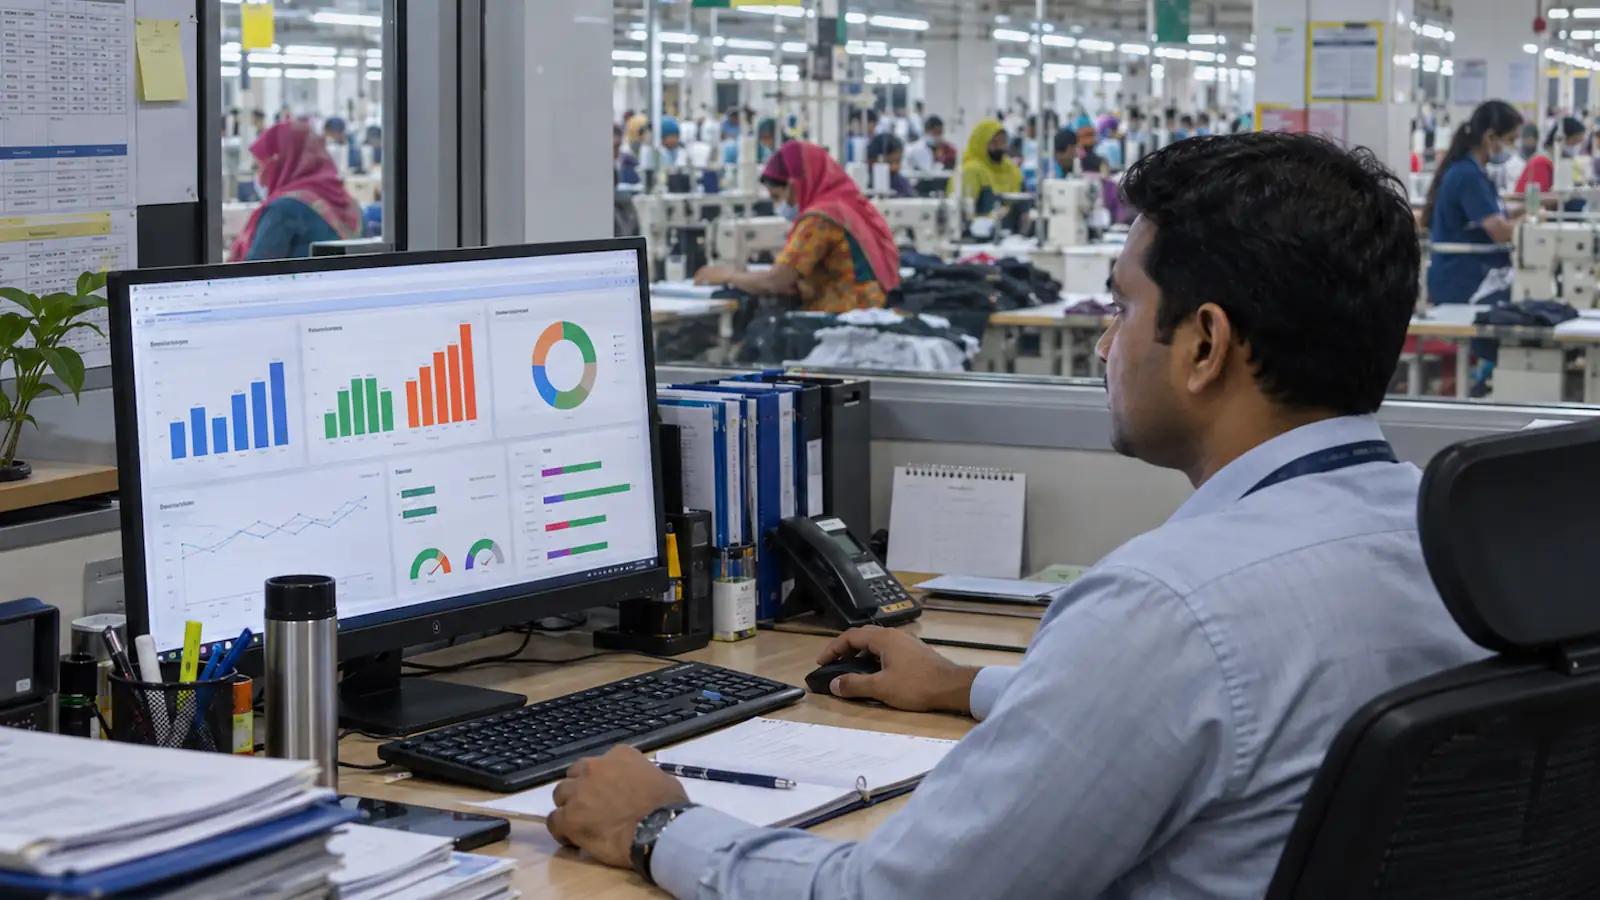
If the supply chain dashboard from Part 1 is the part of the business looking out the window at the buyer, the operations dashboard is the part standing inside the engine room, listening to how it actually runs. It does not care what the buyer was promised. It cares whether the floor can actually deliver on that promise, department by department, minute by minute, and it hands its answer straight back to the same planning function that made the promise possible in the first place.
What the Engine Room Actually Watches
For a factory that spans knitting, dyeing, cutting, sewing, finishing and export under one roof, this dashboard has to cover every stage without drowning anyone in noise. In practice, that comes down to three numbers doing almost all of the real work.
1. Department-Wise and Line-Wise Efficiency
Every department gets a monthly capacity target, and the dashboard's job is to show, department by department, and line by line within it, how actual output compares to that target. A department average hides too much: sewing at "68 percent" can mean every line sitting near 68, or one line at 92 dragging up a line stuck at 45, and those need completely different fixes. The formula is simple and worth knowing by heart: earned minutes, good pieces multiplied by the standard minute value for that garment, divided by the minutes actually available from operators on the line. The site's own sewing line efficiency calculator runs this exact formula, paired with the SMV calculation guide for the standard time itself.
Stage | What efficiency looks like broken down further |
|---|---|
Cutting | Marker efficiency and lay utilization by section, plus how many short-quantity orders are being run as separate, undersized lays instead of a shared one |
Sewing | Efficiency by individual line and by shift, not one sewing-floor average, so a specific weak line gets specific attention |
Finishing | Output against target by finishing section, ironing, packing, carton sealing, since a bottleneck here can quietly delay a shipment even when cutting and sewing both hit their numbers |
Cutting has its own well-known efficiency lever that has nothing to do with operator speed: merging several short-quantity orders that share style and fabric into one lay instead of cutting each one separately, since two small lays almost always waste more fabric and time per piece than the same pieces cut together in one marker. The RMG cutting process guide covers marker planning in full. Sewing has a parallel discipline: a short line-clearance checklist, approved trim card, correct labels, first output signed off, cleared before a new style runs a single piece. It looks like a small, clerical step, which is exactly why it gets skipped under pressure to start on time, and skipping it to save twenty minutes routinely costs hours later in rework, showing up as both low efficiency and a higher DHU on the same day.
2. DHU: The Quality Pulse
DHU, defects per hundred units, is the number that turns quality from a feeling into a fact, and high DHU means high rework eating minutes that were already spent once. The formula, the benchmark scale and a worked example are all covered in this site's own deep dive on DHU, and the DHU and defective percentage calculator runs the numbers for any inspection batch, so it is not repeated here.
3. OEE: How Hard the Machines Are Actually Working
Overall Equipment Effectiveness combines three separate questions into one number: how often a machine is actually available to run, how fast it runs when it is running, and how much of what it produces is actually good. Multiply availability, performance and quality together, and a factory gets a single, honest answer to "how much of this machine's real potential are we actually using." A knitting machine that is available 95 percent of the time but running at 70 percent speed and producing 90 percent good output is not a 95 percent story, it is roughly a 60 percent one, and that gap is exactly where preventive and predictive maintenance earns its keep, since unplanned downtime is usually the single biggest piece missing from that multiplication.
4. Line Layout: The Base Setup Behind Every New Style
Every sewing line has a basic setup behind it, which machines sit in which order, which operation each workstation handles, before a single style-specific adjustment is made. Some planners think of this as the line's chassis: the underlying frame that stays constant while a smaller set of stations gets added, removed or re-timed for each new style. Keeping that base layout on file, instead of re-planning a line from zero every time, is what lets an industrial engineer quote a realistic efficiency number for a new style in hours instead of days, the same planning discipline behind line balancing with linear programming.
This is where it feeds straight back into production planning. When Central Planning is deciding whether a new order fits into next month's capacity, it needs a real efficiency number for that style now, not after a fresh line study, and a base layout on file is what makes that possible. The industrial engineer uses it to avoid re-balancing a line from scratch for every new style. The production planner uses it to size a new order against real capacity instead of a rough guess, the same capacity check covered in Part 1. The line supervisor uses it to know exactly which stations change before the first piece runs. One base layout, reused and adjusted, is what lets all three make a faster, more accurate call.
This matters most on short quantity orders, where it is easy to miss. Every style change costs a line a ramp-up period before it reaches full speed, and that lost time is a small percentage of a long run but a large one of a short run. A reusable base layout, adjusted rather than rebuilt, and a reusable base marker in the cutting room, adjusted rather than redrawn, both shrink that ramp-up cost. That is exactly the efficiency gap a short-run order needs closed, and it is a large part of why some factories can still profitably run small, high-mix orders that others turn away.
Metric | What it really tells you | Where the trouble usually hides |
|---|---|---|
Department efficiency | Is output keeping pace with the target, department by department | One weak department quietly drags down a shipment date the rest of the floor is hitting fine |
DHU | How much invisible rework cost is moving through the floor right now | A rising trend in one stage, hidden inside a flat factory-wide average |
OEE | How much of a machine's real capacity is actually being used | Unplanned downtime, more often than raw machine speed |
Field note: the operations teams that improve fastest break every number down by line, by stage, by shift, rather than staring at the factory-wide average, the same instinct behind a properly built statistical process control chart.
The Standard Dashboards an Operations Team Actually Needs
The same way the supply chain side is not one screen, the operations side is not one screen either. It is a small set of standard views, each one owned by a different person on the floor.
Dashboard | What it shows | Who checks it daily |
|---|---|---|
Line / department efficiency | Actual output against target, broken down line by line and shift by shift within each department, not one factory-wide number | Production manager, industrial engineering |
Sewing line checklist / line clearance | Whether each line has completed its pre-start checklist, trim card approval, correct labels, first output sign-off, before running a new style, and which lines are running right now without one | Line supervisor, quality manager |
Cutting efficiency and lay planning | Marker and lay utilization by section, and which short-quantity orders are eligible to merge into a shared lay instead of being cut separately | Cutting manager, industrial engineering |
Quality / DHU | DHU trend by stage, cutting, sewing and finishing, plus which specific defect types are actually driving it, not just one overall score | Quality manager, line supervisor |
OEE / machine performance | Availability, performance and quality multiplied together, machine by machine or line by line | Maintenance manager, production manager |
Work in process (WIP) | How much unfinished work is sitting between cutting, sewing and finishing, and exactly where it is piling up | Production manager, planning |
Manpower and attendance | Operator attendance against the plan, and its direct effect on that day's available capacity | HR, production manager |
Line changeover and ramp-up | How long each style change takes a line to reach full speed, flagged separately for short quantity orders where that cost matters most | Industrial engineer, production manager |
Shipment readiness | Finished goods actually packed and ready, measured against the planned ship date, days before it arrives rather than the morning of | Finishing manager, sales head |
Same rule as the supply chain side: these dashboards are only trustworthy if they are all reading from one shared ERP system, not six separate exports that quietly stop agreeing with each other after a few weeks.
The Role of Central Planning: Closing the Loop Back to the Buyer
A factory can have a genuinely excellent supply chain dashboard and a genuinely excellent operations dashboard, and still lose money, because nothing is making sure the two are looking at the same reality. If the commercial team is confirming orders against one spreadsheet and the production team is planning capacity against another, the two numbers drift apart quietly until a shipment date proves it loudly.
Central Planning is what closes that gap, and it runs in both directions. Looking forward, it is the function that checked, back in Part 1, whether an order belonged in the frozen, slushy or forecast zone before a delivery date was ever promised. Looking backward, it takes everything this operations dashboard just measured, efficiency, DHU, OEE, and feeds it straight back into how much real capacity the factory can honestly offer next month. A department quietly running at 60 percent efficiency is a capacity number Central Planning needs today, not at the next quarterly review, because it directly changes how many new orders the commercial side can safely confirm.
One shared number, updated once: the moment an order is confirmed, the same system that recorded it also updates the capacity plan, instead of someone re-typing it into a second spreadsheet a day later
Capacity checked before the promise is made: Central Planning can answer "do we actually have sewing capacity next month for this order" before a delivery date is promised to the buyer, not after
The loop closes itself: when a department finishes an order, or its efficiency and DHU numbers shift, that same update should be what moves the supply chain dashboard's shipment status and future capacity picture, instead of a phone call or a message asking someone to update it manually
None of this holds together without a proper ERP system underneath it. This is the same discipline covered in building a manufacturing analytics stack: pick the shared source of truth first, then build dashboards and planning rules on top of it, rather than building dashboards on top of whatever data happens to already exist in three different places.
Where Bangladesh's RMG Industry Actually Stands in 2026
Bangladesh still holds a commanding position in the European market, but Vietnam holds a noticeably larger share of US apparel imports today, largely because Vietnamese manufacturers run shorter, more integrated supply chains and have moved further into higher value, fashion-forward product, while Bangladesh has historically competed hardest on price. That price advantage is not guaranteed to last: Bangladesh's eventual graduation from least developed country status risks new tariffs of up to roughly 12 percent under EU safeguard measures, at a time when demand is soft and buyers are resisting price increases. Industry leaders have been direct that without real gains in productivity and shorter lead times, the industry's long-standing cost advantage stops being enough on its own, and economists studying the sector point to the same digital production planning and quality assurance capability this series has been describing as part of the answer.
None of this gets solved by one dashboard. But a factory that already knows, in real time, whether it is hitting its sales targets, whether materials are arriving on schedule, whether lines are running efficiently, and whether the defect rate is trending up or down, connected end to end by a Central Planning function that checks capacity before a promise is made, can make faster, better-informed decisions than one still waiting for a month-end report to find out the same things. In an industry where the price cushion is shrinking, that speed is quickly becoming as valuable as the price itself.
Central Planning and ERP Checklist
Order confirmation and capacity planning draw from the same system, not two separately maintained records
Capacity is checked against the frozen, slushy and forecast zones before a delivery date is promised to a buyer, not confirmed and hoped for afterward
Style, BOM and buyer master data are kept in one place and used by every module, so planning, production and shipping are never working from different versions of the same order
A written, agreed rule exists for how a forecast becomes a confirmed order, including what happens when the confirmed style, quantity or date does not match the original forecast
A clear minimum quantity or merge rule decides when small orders are combined into one production booking instead of each taking its own slot
Leftover capacity or stock from a cancelled or partially confirmed order is recalculated and released back into the plan, not left sitting idle and unaccounted for
Every manual override or capacity reallocation is logged with who made the change and why, so a booking decision can be traced back later
Efficiency, DHU and OEE are tracked line by line and stage by stage, at the same frequency as the sales and delivery numbers, not as one blended factory average on a slower cycle
Short-quantity orders sharing style and fabric are checked for a shared cutting lay before being scheduled as separate, undersized ones
A production delay or efficiency drop is visible on the supply chain dashboard the same day it happens, not discovered at the next shipment deadline
Both dashboards, and the planning function connecting them, are reviewed together on a regular cadence, not treated as three separate departments' separate concerns
Final Word
Supply chain management and operations management are not two separate businesses wearing the same company badge. They are two views of the same factory, one looking out toward the buyer, one looking inward at the floor, and Central Planning, built on a real ERP system rather than a handful of disconnected spreadsheets, is what keeps those two views honest with each other in both directions. In a market where the old cost advantage is under real pressure, that connection is no longer a nice-to-have dashboard project. It is quickly becoming the difference between a factory that finds out about a problem in time to fix it, and one that finds out when the buyer already has.
This closes the two-part series on connecting supply chain and operations through Central Planning. Part 1 covered the supply chain side, order intake, material receipt and on time delivery, and this second part covered the operations side and the ERP-driven planning function that has to tie both together, in both directions, for good.

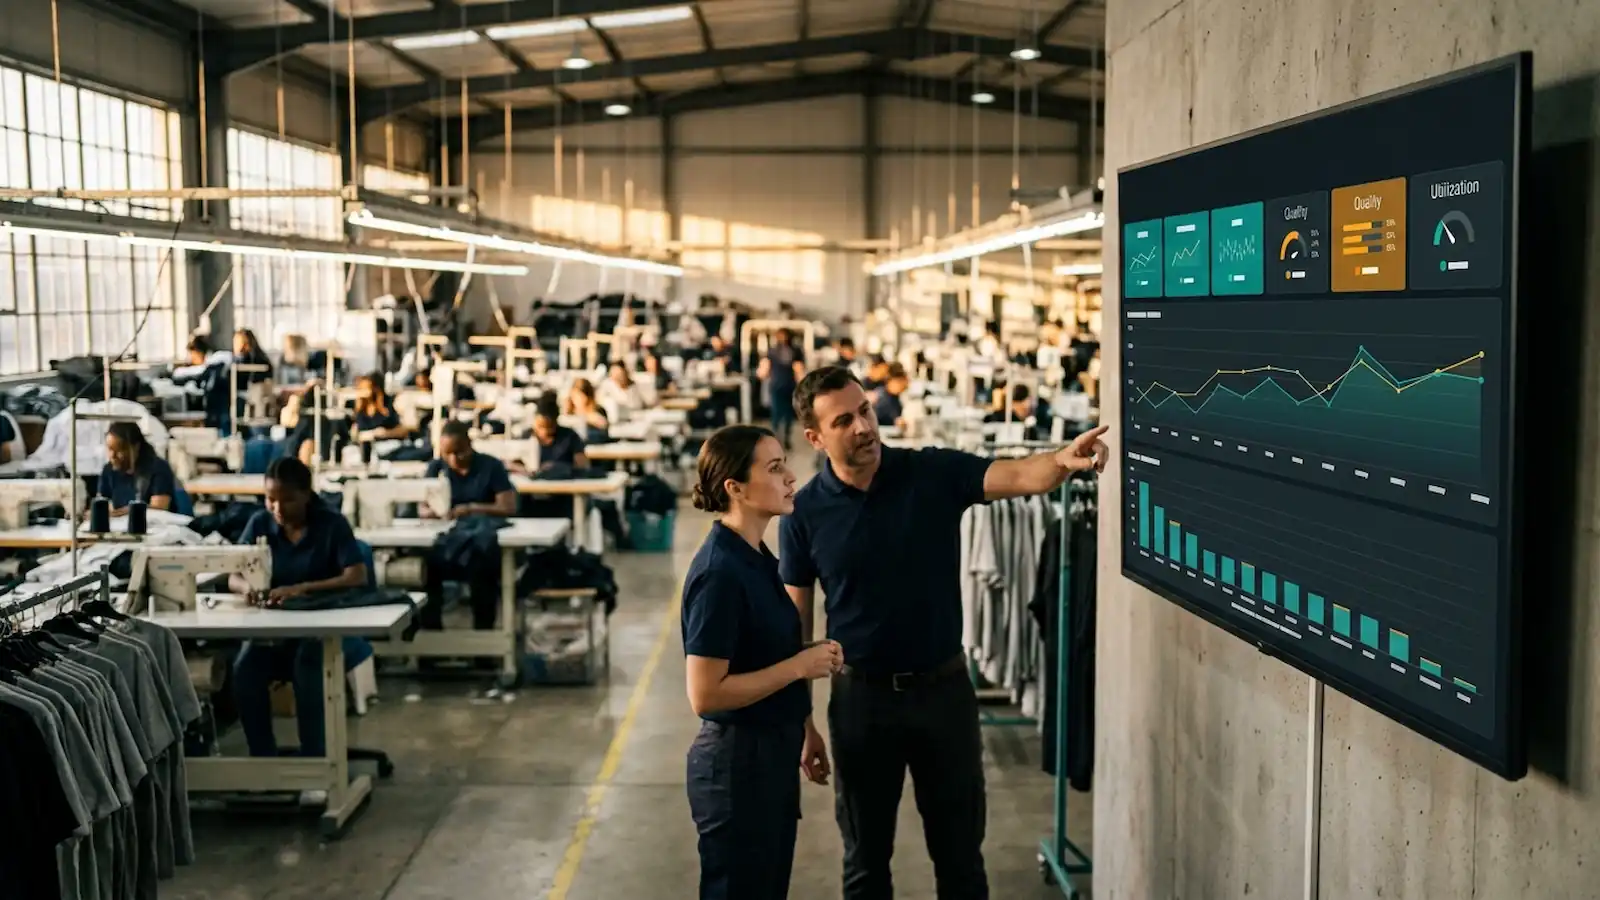
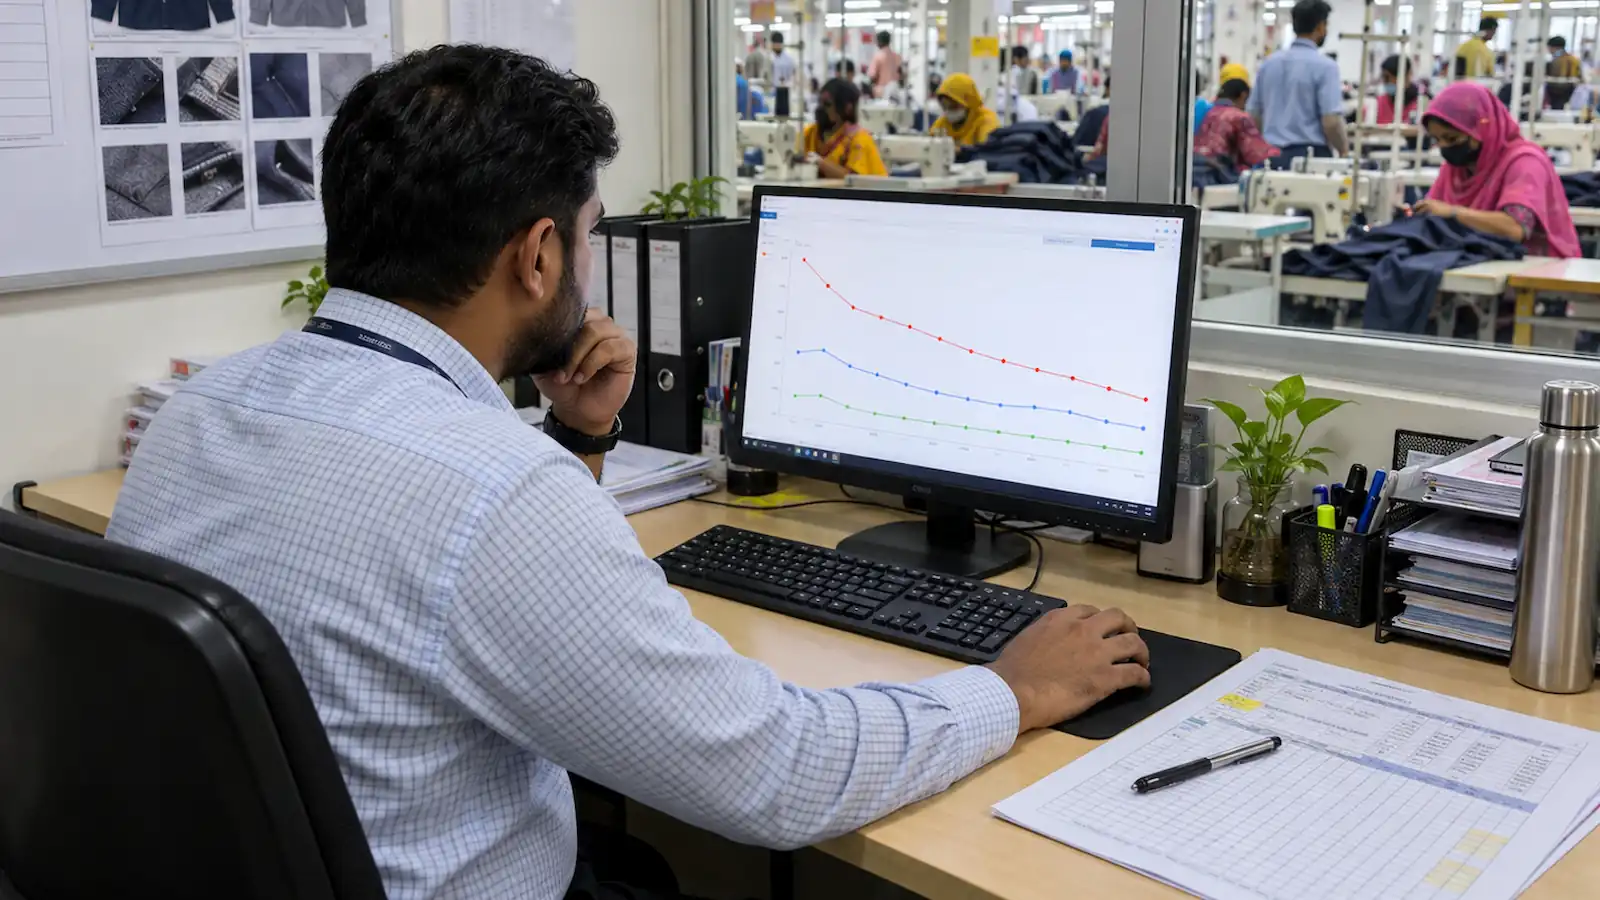
Discussion0
Loading the discussion…