
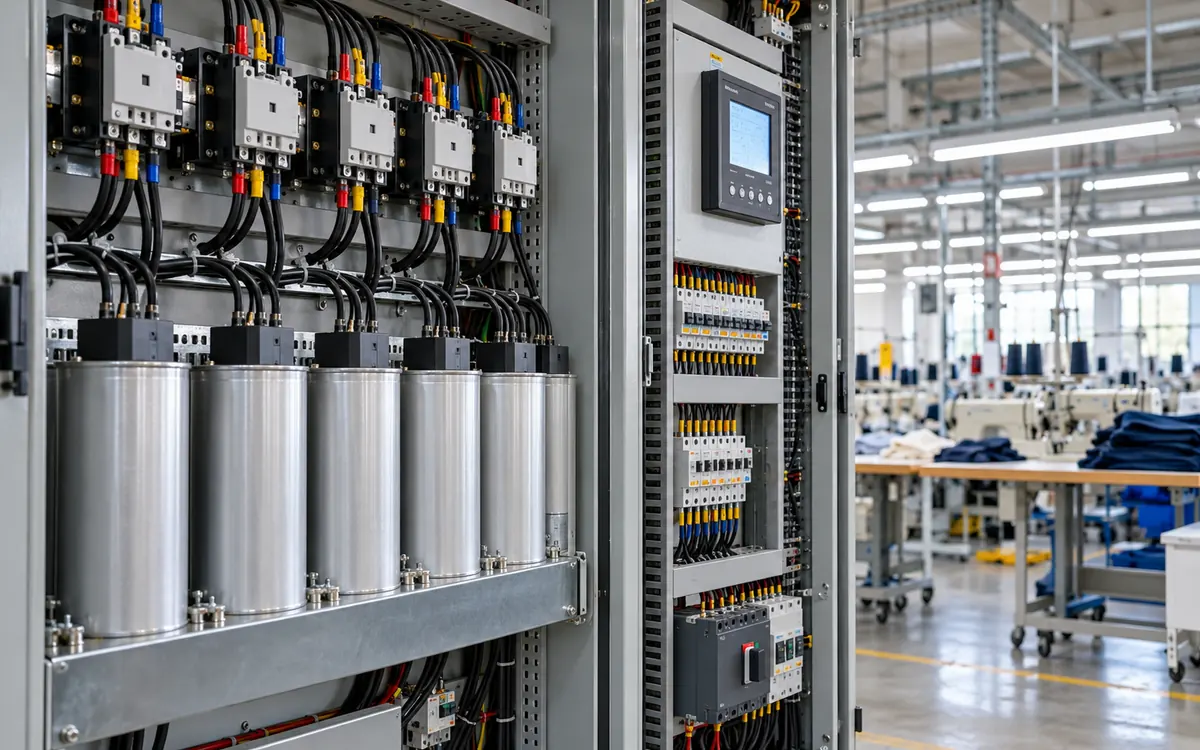
Start with the bill and the load
A garment factory can improve power factor and still see little change in its electricity bill. The result depends on the tariff, the load pattern, and where the correction equipment sits. A lower current reading alone does not prove an energy saving.
The useful question is specific: which cost or limit will the project change? The answer may be a power factor charge, billed demand in kVA, or losses in a feeder. It may also be extra capacity in a transformer that is near its current limit. Each benefit needs its own evidence.
This guide builds a measured case for power factor correction. It explains the electrical balance and capacitor calculation. It also covers changing loads and checks after installation. All factory figures and prices below are hypothetical. They show a method, not expected savings for a real site.
Begin with the factory utility load register. Use it to identify circuits and equipment. Then add measured data. A nameplate list cannot show changes in reactive power. Measure it during breaks, start-up, and low production shifts.
Keep kW, kvar, and kVA separate
Active power, measured in kW, supplies work and heat. Energy billed in kWh is active power accumulated over time. A 20 kW load running steadily for three hours uses 60 kWh.
Reactive power, measured in kvar, describes another part of an AC circuit's power exchange. Motors and other inductive loads can draw lagging reactive current. A shunt capacitor supplies a leading reactive component. These components can offset one another upstream of the connection point.
Apparent power, measured in kVA, reflects voltage and total current. For a balanced three-phase circuit, apparent power is:
S = √3 × V × I / 1,000
Here V is line-to-line voltage in volts. I is line current in amperes. The result is kVA. Use a suitable meter for unbalanced or distorted waveforms. The simple balanced calculation may not describe them well.
Power factor is the ratio P/S. Schneider Electric's definition links this ratio to active and apparent power. The magnitude of power factor does not exceed one. A leading power factor is not a value above one.
For a sinusoidal load, S² = P² + Q². This power triangle supports the basic capacitor calculation. It does not mean that the difference between kVA and kW is wasted kWh. Subtracting unlike quantities cannot give an energy loss.
Write units beside every figure on the project sheet. This simple habit catches a common error: applying an energy price per kWh to a reduction measured in kVA.
Check which power factor the meter reports
Displacement power factor describes the phase angle between the fundamental voltage and current. True power factor includes the effect of the full current waveform. They can differ where drives, power supplies, and other nonlinear loads are present.
Consider an ideal teaching case with a sinusoidal supply voltage. Let fundamental displacement power factor be 0.98. Let current total harmonic distortion, relative to fundamental current, be 60%. The total current is then √(1 + 0.60²), or about 1.166 times the fundamental current.
Under these assumptions, true power factor is:
0.98 / √(1 + 0.60²) = 0.840
The phase angle looks good, yet the total current remains high. Ordinary capacitors do not remove this distortion. This simplified calculation also assumes no material harmonic voltage contribution to active power. Use measured true power factor for the real installation.
Record the meter's field names and settings. Do not merge a displacement reading from one instrument with a true reading from another. Check the sign convention too. Some meters use different signs for import, export, leading, and lagging conditions. Schneider's meter guidance explains why the displayed sign needs that context.
Build a baseline that includes low load
Collect interval records for active power, reactive power, apparent power, voltage, and current. Add true power factor and harmonic data where the instrument supports them. Include normal production, breaks, idle periods, and different shift patterns.
A single midday reading can size a bank that is too large at night. A single bill may hide brief problems or combine many operating conditions. Record both the electricity billing method and the changing load.
Use the following baseline sheet as a starting point.
Field | Why it matters | Useful supporting record |
|---|---|---|
Meter boundary | Defines which loads the bank will serve | Single-line drawing |
Interval date and time | Links demand to production events | Shift and downtime log |
kW and kvar | Shows the active and reactive duty | Meter export |
True and displacement power factor | Separates phase shift from distortion | Instrument settings |
Voltage and harmonic spectrum | Helps assess capacitor duty | Power quality survey |
Bank steps already in service | Prevents double counting correction | Controller history |
Supply source | Identifies grid and generator conditions | Changeover log |
Validate current transformer ratios and meter wiring before using the data. Check for reversed phases, wrong ratios, and missing voltage inputs. Any of these can create a false trend. Ask the electrical team to resolve odd results at the instrument, not by editing the spreadsheet.
Read the tariff before estimating savings
Factories can face several charging methods. Some tariffs charge only active energy and fixed items. Others add kW demand, kVA demand, reactive energy, or a power factor adjustment. The exact terms govern the business case.
Eaton's plant engineer guide illustrates several billing arrangements. Its examples show why the tariff must be known. Do not reuse the example rates as current prices for another factory.
Make a plain-language tariff note. State the demand interval, the charge unit, and the billing window. Add any minimum demand, contract level, seasonal rule, or historical demand floor. Identify how power factor is measured for the adjustment.
If the bill uses monthly reactive energy, a correction at one peak moment may have little value. If it uses peak kVA, the bank must operate during the interval that sets that peak. If it uses kW demand alone, a large kVA reduction does not create the same reduction in billed kW.
Keep the bill calculation separate from the equipment rating calculation. They answer different questions. One estimates money; the other defines the required electrical duty.
Work through a capacitor calculation
Assume a balanced, sinusoidal load of 320 kW at 400 V. The initial power factor is 0.75 lagging. The study target is 0.95 lagging at this operating point.
These are calculation inputs, not a universal target. The final target must suit the tariff, load changes, and electrical design.
For the assumed load, reactive power is:
Q = P × tan(arccos PF)
The required capacitor output is:
Qc = P × [tan(arccos PF₁) − tan(arccos PF₂)]
Schneider's compensation principles give this relationship. Keep the calculator in a consistent angle mode. Do not enter the power factor itself as an angle.
The original reactive power is 282.21 kvar. The target reactive power is 105.18 kvar. The required correction at this point is therefore:
Qc = 282.21 − 105.18 = 177.03 kvar
The same case gives the following results.
Quantity | Before correction | At the target |
|---|---|---|
Active load | 320.00 kW | 320.00 kW |
Reactive demand | 282.21 kvar | 105.18 kvar |
Apparent power | 426.67 kVA | 336.84 kVA |
Line current at 400 V | 615.84 A | 486.19 A |
Power factor | 0.75 lagging | 0.95 lagging |
This table holds active load power constant. It ignores the small change in feeder losses and the bank's own losses. Those effects need a separate calculation.
A practical bank uses available step sizes and equipment ratings. A result of 177.03 kvar is not an instruction to buy a fixed 180 kvar bank. The minimum load, harmonic study, operating voltage, and switching duty still need review.
Calculate a billing benefit on the correct basis
Suppose a hypothetical tariff charges 12 currency units per billed kVA each month. Assume the same operating point sets the monthly demand before and after the change. There is no minimum or historical floor in this example.
Use the unrounded demands to avoid rounding drift. The kVA reduction is:
(320 ÷ 0.75) − (320 ÷ 0.95) ≈ 89.82 kVA
The monthly demand benefit is about:
[(320 ÷ 0.75) − (320 ÷ 0.95)] × 12 ≈ 1,077.89 currency units
That result depends on the assumptions. It disappears if another uncorrected interval still sets the same bill peak. It shrinks if the tariff applies a floor above the new demand. It also changes if active load rises after the project.
Do not multiply this benefit by twelve without checking the other months. A garment factory may have a low seasonal load, a shutdown, or a different mix of sewing and finishing work. Build one row per billing period using the applicable rate and measured load profile.
Keep avoided capacity costs separate. A smaller current may postpone a transformer upgrade, but that value needs a real expansion plan. It is not annual cash saved from the present electricity bill.
Estimate feeder losses without overstating them
For a fixed conductor resistance, resistive loss varies with current squared. In the example, the current ratio is 0.75/0.95. The new loss is therefore about 0.6233 of the old loss in the affected circuit section.
That is a 37.67% reduction in those losses. It is not a 37.67% reduction in factory electricity use.
Suppose the affected upstream feeder originally loses 4.00 kW at this load. The estimated reduction is:
4.00 × [1 − (0.75/0.95)²] = 1.507 kW
At 5,000 equivalent hours, this avoids about 7,534.6 kWh. A hypothetical energy price of 0.12 per kWh gives 904.16 currency units per year.
Now assume the correction equipment consumes an average 0.27 kW during those hours. Its annual energy cost is 0.27 × 5,000 × 0.12 = 162.00. The net energy benefit is about 742.16 before maintenance.
This is a simplified estimate. Actual resistance changes with temperature, and the load varies. Use interval current and suitable circuit data for a stronger calculation. Include reactor and cooling losses where relevant.
NIST's study of correction devices makes a key point. Less current does not mean an equal drop in active energy use. Its study concerns household devices, so it is not an industrial savings benchmark. The electrical distinction still helps prevent a misleading claim.
Choose the location to match the benefit
A bank at the main switchboard can reduce reactive current through the supply transformer. It does not remove the reactive current in each downstream motor feeder. A bank closer to a load changes a different part of the network.
Schneider's location guidance distinguishes whole-site, group, and individual correction. The key question for a loss estimate is where the current actually falls.
Mark the proposed bank on the single-line drawing. Shade the circuit sections upstream of that point. Only include a section in the loss benefit when the proposed scheme reduces its current.
Also consider access, dust, ambient heat, ventilation, cable routes, and shutdown needs. A location that looks ideal electrically may be poor for inspection and repair. Give each bank and controller a clear asset number.
Individual motor correction needs a suitable design for the starter and protection scheme. A variable-frequency drive output needs special care. Do not connect ordinary correction capacitors there unless the manufacturer approves it. The drive's output waveform and controls make this a different application from a line-connected motor.
Match bank steps to changing demand
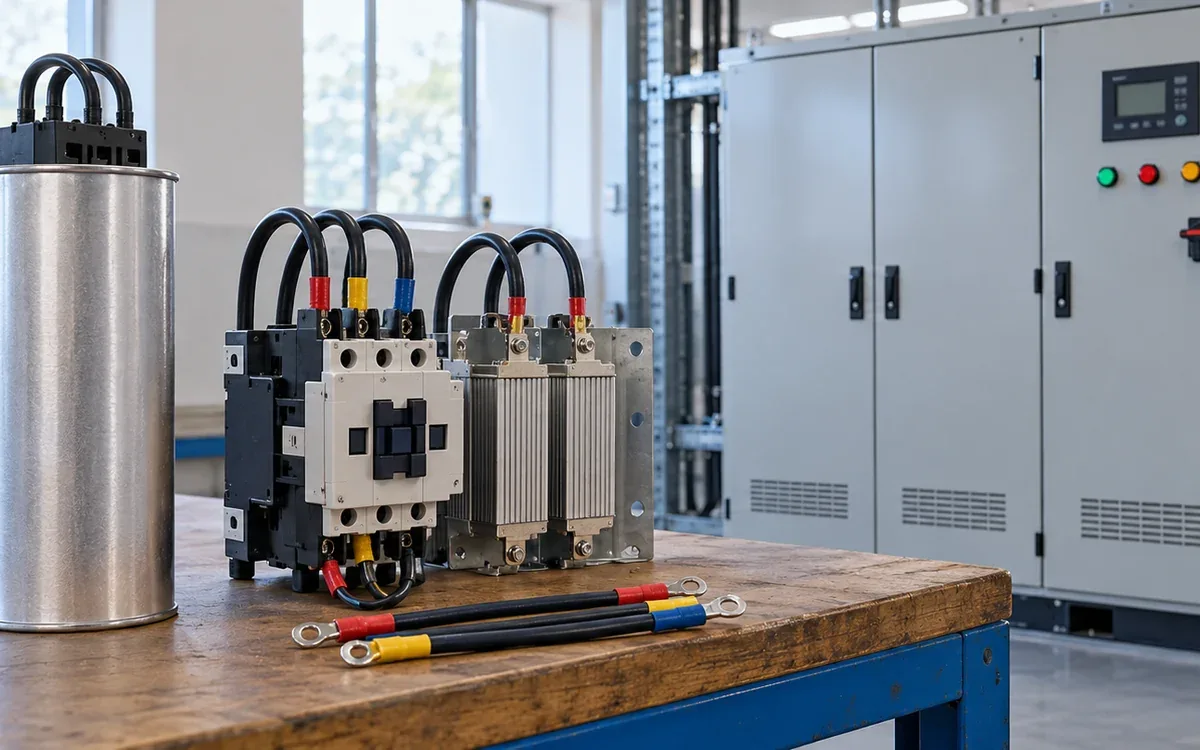
A fixed bank supplies roughly constant reactive output at a given voltage and frequency. An automatic bank switches steps to follow demand. Schneider's equipment guide describes these options.
The low-load check is essential. Suppose the factory later draws 60 kW and 40 kvar inductive. If the full 177.03 kvar remains connected, net reactive power becomes:
40 − 177.03 = −137.03 kvar
The magnitude of power factor is then only about 0.401, and it is leading. Adding more capacitance has made this operating point worse.
Review the smallest stable load, not only the average. Choose step sizes that allow useful control in that range. Specify time delays and reconnection rules with the equipment supplier. Fast process changes may need a different switching method from slow shift-level changes.
Step output also depends on voltage. For the same capacitor at the same frequency, kvar varies with voltage squared. A bank rated 180 kvar at 400 volts gives about 162.45 kvar at 380 volts. Check the bank design and rated conditions to find its actual output.
Treat harmonics as a system design issue
Capacitors can interact with network inductance. This can amplify harmonic currents or voltages near a resonant condition. The result may affect the bank and other equipment on the bus.
ABB's technical guide explains the role of resonance, detuned reactors, and filtering. A detuned bank is not a universal promise to remove all harmonics. Selection depends on the supply, load spectrum, and bank design.
Give the designer the transformer ratings and impedance. Include fault levels, existing banks, and major nonlinear loads. Include generator operation and planned drive additions. A change in supply source can change the network conditions.
Request a written basis for the proposed design. It should explain why plain capacitors, a detuned bank, or another solution suits the measured case. A single total distortion percentage does not describe every possible risk.
Also review switching transients, discharge arrangements, fault protection, and thermal duty. These are design and installation tasks for qualified electrical staff. A kvar calculation alone does not establish safe equipment ratings.
Repair an existing bank before adding more
Low power factor does not always mean the factory needs a larger bank. An installed bank may have lost steps. Its controller may be in manual mode. A new feeder may also bypass the point that the controller measures.
First compare the drawings with the physical installation. List each step, its rated output, and its measured availability. Check that each step carries the expected current when switched on. A controller lamp alone is weak evidence.
Suppose the original design has six equal steps. Only four now operate. Buying a second bank may restore the daytime reading. Yet two faults remain in the old equipment. The new arrangement may also overcorrect after those faults are later repaired.
Prepare three options for review: restore the existing design, modify it for the present duty, or replace it. Price the same required performance in each option. Include shutdown time, testing, spare parts, and any needed change to protection. This makes the options comparable.
Do not assume a failed fuse is the root cause. Repeated failure may point to a wider electrical or thermal problem. Let the investigation explain why the step failed before the team puts it back into service.
Show the financial case under weaker conditions
Use a base case and a conservative case. In the conservative case, reduce the number of months when the bank changes billed demand. Also allow for planned maintenance and an interval when a step is unavailable.
For example, eight months at the calculated demand benefit give about 8,623.16 currency units. Twelve such months give about 12,934.74. The difference is large enough to change a purchase decision. Neither figure includes the separate loss benefit or maintenance cost.
Show which assumption drives that range. If it is peak timing, collect more interval data. If it is bank availability, improve the maintenance plan. Extra precision in the capacitor formula will not resolve uncertainty in the bill.
Specify acceptance tests before buying
Write the acceptance criteria early. The load data and cost assumptions should still be clear. A useful purchase specification describes operating conditions, not just a box rated in kvar.
State the voltage and frequency range. Define the required correction at several loads. Include the expected ambient conditions, enclosure needs, and supply arrangements. Require drawings, settings, component data, maintenance instructions, and an accessible alarm history.
For acceptance, agree how the team will measure performance. Tests should include a normal peak, a lower load, and step changes. Define which meter and which power factor field will decide the result. State how unavailable production conditions will be tested later.
Ask for the expected bank losses at the proposed duty. This lets finance include them in the energy estimate. Ask which consumable or ageing parts require review and what evidence shows a failed step.
Avoid a guarantee phrased only as “power factor above 0.95.” It may ignore leading operation, true power factor, or harmonic limits. A more useful guarantee ties performance to a defined load range and system condition.
Verify operation and keep the savings traceable
During commissioning, compare meter readings before and after each approved step change. Confirm the direction of reactive power change. Check that the controller measures the correct bus and responds as intended.
Run the low-load test. Confirm that unwanted steps drop out and that the system does not hunt between states. Inspect current balance and temperatures using the supplier's method. Record alarms and settings before handing over the plant.
For the commercial check, rebuild the bill using the tariff. Compare like operating periods and explain production changes. A smaller bill during a shutdown does not prove a capacitor benefit. A higher bill during increased output does not prove failure either.
Report three results in separate lines. Show electrical performance, tariff benefit, and loss reduction. Label the last item clearly when it is too small to resolve with available meters.
Add the bank to the maintenance programme. Check for failed fuses and worn switching devices. Poor ventilation and lost controller settings can also erode results. Track available kvar, alarms, and time out of service. Repeat the study after major changes to drives or supply equipment.
Troubleshoot the result, not just the display
Observed result | Plausible issue | Next check |
|---|---|---|
Power factor stays low with steps on | Missing step or wrong measurement | Step current, fuses, meter wiring |
Power factor becomes leading at night | Too much fixed correction | Minimum load and control logic |
Good displacement factor but poor true factor | Distorted current waveform | Harmonic survey and meter definitions |
Main current falls but kWh hardly changes | Expected tariff and loss distinction | Active energy and feeder loss model |
Bill benefit is smaller than predicted | Peak timing or tariff floor | Full interval record and bill rules |
Bank runs hot or trips | Thermal, harmonic, or component issue | Supplier-led electrical assessment |
Record the evidence before changing settings. Repeatedly raising the target to make one display look better can conceal the real cause.
Frequently asked questions
Does power factor correction reduce motor energy use?
It does not directly remove the active energy needed for the motor's work. It can reduce upstream losses where current falls. Assess motor efficiency and process duty separately.
Is unity always the best target?
No. The useful target depends on the tariff, load range, step control, and system design. A target close to unity can leave little room for load changes. Check leading operation as well as lagging demand.
Can the monthly average size the bank?
It can support an early estimate, but it cannot describe the full duty. Peak correction needs and low-load limits may differ greatly. Use time-based records and a power quality assessment.
Can a capacitor bank solve every low power factor problem?
No. It can offset inductive reactive demand under suitable conditions. Distorted current, faulty measurement, and poorly controlled equipment need their own diagnosis. The solution should follow that diagnosis.
Turn the calculation into a measured project
Start the project with a load record and a clear tariff calculation. Select equipment for the whole operating range. Then check electrical performance and money saved.
Keep kW, kvar, kVA, and kWh distinct throughout. Verify the low-load case, the bank location, and harmonic duty. That discipline turns a promising power factor reading into a result the factory can maintain and explain.
References
Schneider Electric: Definition of power factor.
Schneider Electric: Power factor sign conventions.
Eaton: Power factor correction, a guide for the plant engineer.
Schneider Electric: Theoretical principles of compensation.
NIST: Utility power factor correction devices.
Schneider Electric: Capacitor bank locations.



Discussion0
Loading the discussion…