
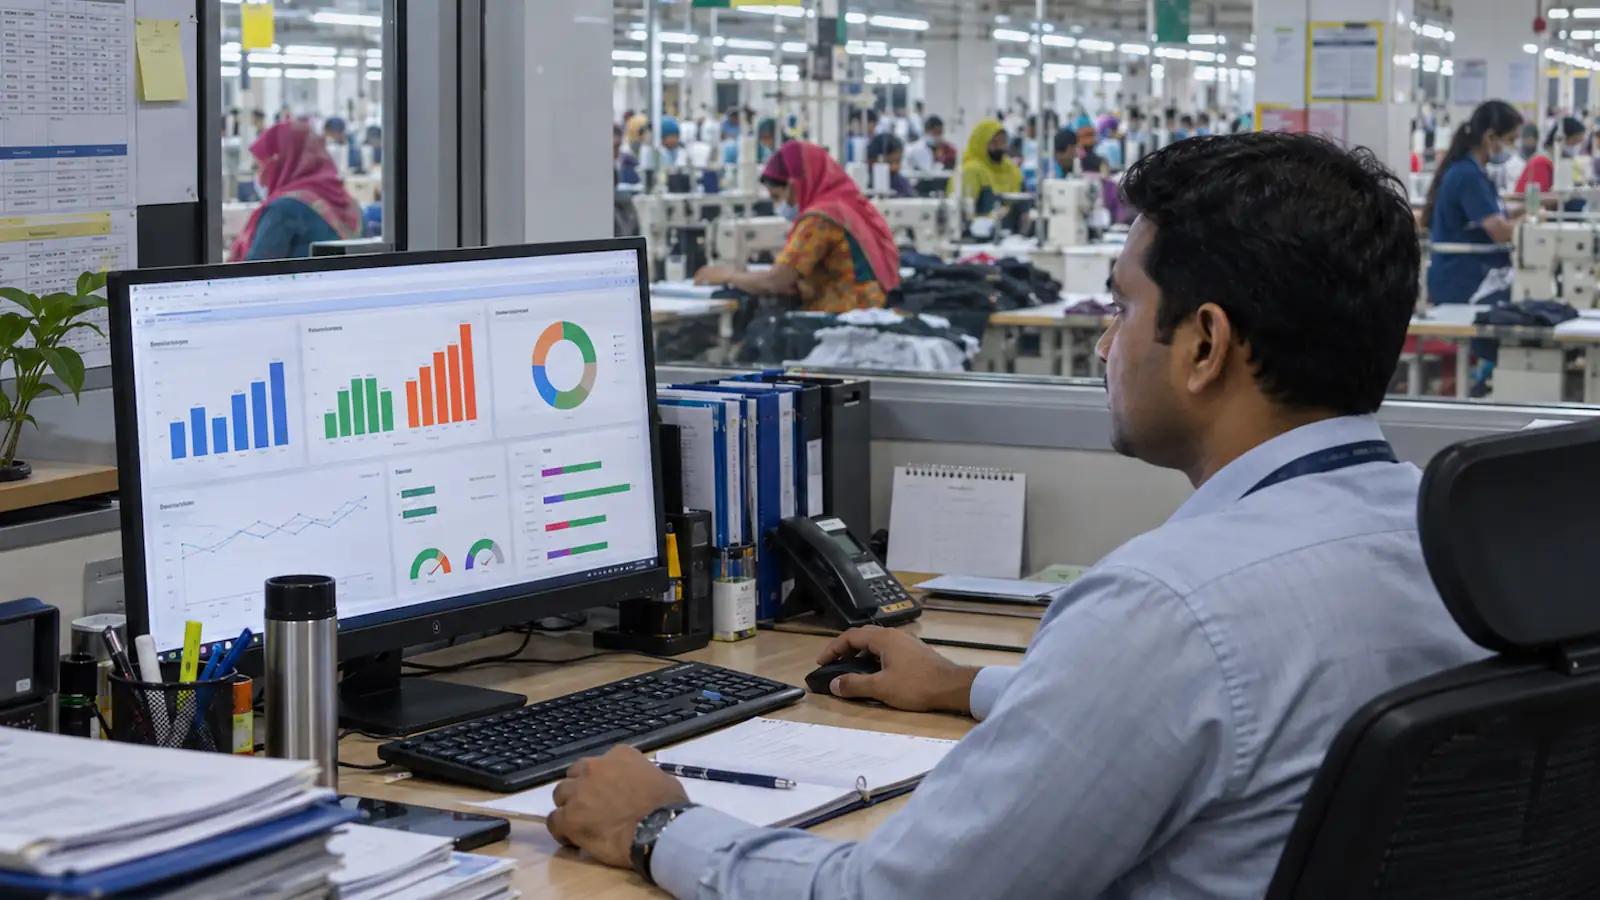
A regional sales head opens the monthly numbers and finds that primary sales to distributors are up 9%, but three key towns have gone quiet on reorders. Nobody noticed for eleven weeks, because nobody was tracking sell-out, only sell-in. That gap between what leaves the factory and what leaves the shelf is where most route-to-market decisions actually get tested.
The cost of getting this wrong is not abstract. A distributor sitting on 90 days of unsold stock stops ordering long before head office sees the drop in a report, and by the time it shows up, a competitor has taken the shelf facing. A direct sales force running under 30 productive calls a day burns salary and fuel on routes that were never dense enough to justify direct coverage. Both failures trace back to the same root cause: a distribution model chosen on gut feel, rather than built on the geography and economics of the specific market being served.
What Are the Main Route-to-Market Models in FMCG?
Five structures cover most of what is run in the field. Each trades control for cost differently.
Direct distribution. The manufacturer's own sales force calls on retail outlets directly, with company-owned or leased vehicles and warehousing. This is the highest-control, highest-fixed-cost model. It earns its keep only where drop sizes are large or call density is high: modern trade, wholesale, and dense urban general trade where a route sustains 40 or more productive calls a day within a tight radius.
Super-stockist / distributor model. An independent distributor buys stock on their own account, carries the working capital, and resells to a defined territory of outlets. Visibility stops at the primary sale unless a secondary-sales capture system is built on top, often the first piece worth building in a wider analytics stack for a mid-sized manufacturer, since every downstream forecast depends on it. The distributor's balance sheet is, in effect, the brand's inventory buffer.
Cash-and-carry. A wholesale-format outlet where smaller retailers and even end consumers buy in bulk against cash, with no delivery and no credit extended downstream. It is the lowest-cost, lowest-control model, best suited to fragmented, low-value-per-drop outlets a direct or distributor sales force cannot economically reach.
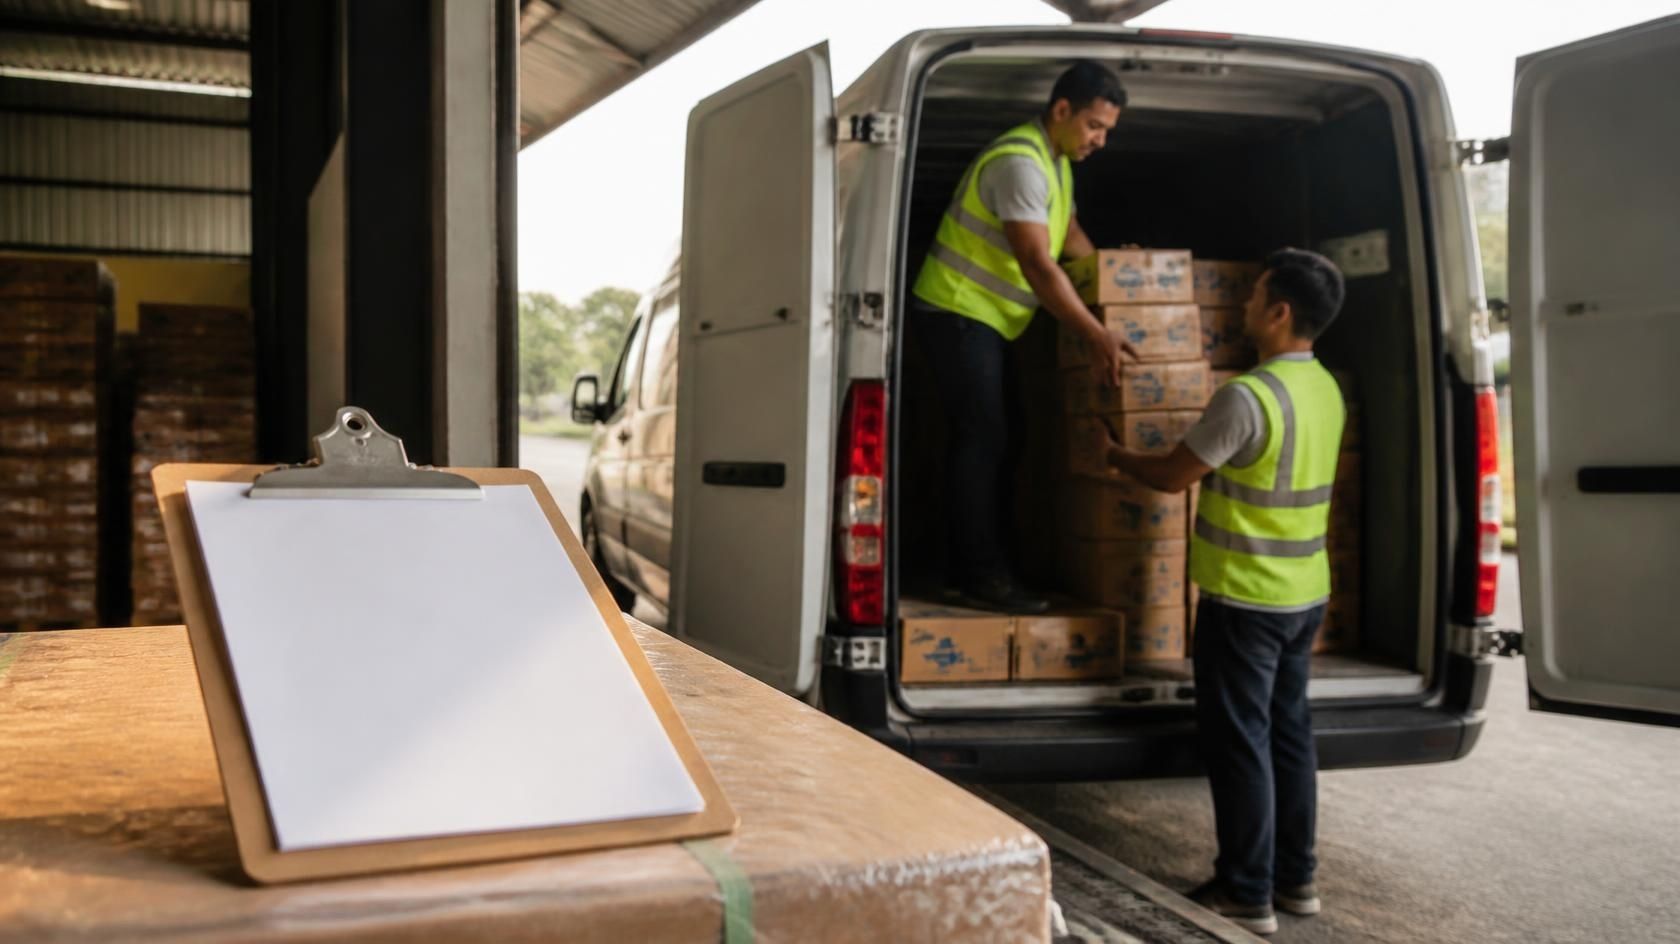
Van selling (DSD: direct store delivery). A hybrid of direct and distributor: a pre-loaded van visits outlets on a fixed route, sells and delivers in the same call, and books the order on the spot. It compresses order-to-delivery to zero but caps SKU range to what fits on the van.
Modern trade direct vs. general trade through distributors. Less a fifth model than the hybrid every mature FMCG operation runs: key accounts and large-format modern trade go direct for volume and negotiating power, while the long tail of general trade runs through distributors because no manufacturer can profitably staff 40,000 small outlets.
Field note: A mid-sized snacks manufacturer converted one distributor territory to direct coverage expecting a clean margin gain. Numeric distribution fell from 61% to 44% over the first two quarters. The incumbent's relationships and informal credit terms with small shopkeepers were not replaceable overnight, and the direct team took nine months to rebuild an outlet list built over six years.
How Do You Choose Between These Models?
The choice is a geography and economics question before it is a control question. Five variables should drive it, and none of them is "what do we prefer."
Criterion | Favors Direct | Favors Distributor / Cash-and-Carry |
|---|---|---|
Market density | Dense urban clusters, 40+ calls/day feasible on one route | Dispersed rural or peri-urban geography, long inter-outlet distances |
SKU velocity | High-turn SKUs justifying frequent, small-drop visits | Long-tail or seasonal SKUs where visit frequency doesn't pay for itself |
Credit risk | Manufacturer can absorb receivables and enforce terms directly | Distributor better positioned to assess and chase local shopkeeper credit |
Geographic spread | Concentrated metro or regional footprint | National or multi-state spread beyond one sales force's practical reach |
Category type | Modern trade, wholesale, large-format: big drop sizes | General trade, fragmented small-format retail: small, frequent drops |
Most networks are not a single answer down this table: direct in the top-left cells, distributor-run everywhere else, which is why the hybrid dominates.
What Does Cost-to-Serve Actually Measure?
Cost-to-serve is route cost divided by productive daily calls: salesman pay, vehicle cost, fuel, and delivery labor, divided by calls that actually result in an order. It is the number that should decide route restructuring, not gut feel about which routes "feel" underperforming.
A representative comparison: a direct route running 42 calls a day at a 72% strike rate generates roughly 30 productive calls; a distributor-run route on the same territory might manage 38 calls at a 65% strike rate, or about 25. Direct keeps the full margin but carries the fixed cost of the sales force and fleet regardless of volume; the distributor route surrenders 8–12% of margin but converts that fixed cost into a variable one. The break-even is usually expressed as a required monthly throughput per route: below it, the distributor structure wins on cost; above it, direct starts to pay for itself.
How Do Distributor Margins Cascade to Shelf Price?
A distributor is not optimizing for margin percentage. They optimize for return on the capital tied up in inventory. A 6% margin at 18 annual stock turns beats a 10% margin at 7 turns, because the 6%-margin distributor redeploys working capital nearly three times as often, the same trade-off our comparison of EOQ versus periodic review inventory policy works through for whoever sets the distributor's replenishment rules.
Layer | Typical Margin Range | Basis |
|---|---|---|
Distributor margin | 4–10% | Compensation for capital, credit risk, and secondary logistics |
Wholesaler / sub-distributor (where present) | 2–5% | Extends reach into fragmented outlets the primary distributor can't cover profitably |
Retailer margin | 8–20%, category-dependent | Shelf space, staff time, and category-specific turnover expectations |
Trade schemes / promotional discounts | 2–6% variable | Volume incentives, scheme periods, and new-SKU push money layered on top |
Every layer added between factory and shelf increases landed shelf price (packaging choices alone move that number more than most teams expect, a point our piece on packaging decisions that quietly inflate FMCG landed cost walks through) and dilutes the manufacturer's control over what the consumer actually sees, precisely why modern trade and high-volume urban general trade get pulled toward direct coverage wherever the economics allow it. The trade schemes line in the table above deserves the same scrutiny: without measuring the actual lift a promotion delivers, that spend often looks effective while mostly just pulling forward sales that would have happened anyway.
What Goes Wrong Most Often in RTM Execution?
Channel Conflict Between Direct and Distributor Accounts
The most common failure is a direct team and a distributor's team both servicing outlets in the same postal code, usually because territory boundaries were drawn on a map rather than an actual outlet list. The direct team undercuts the distributor's price to hit its own number, outlets defect, and the distributor stops ordering in retaliation. Boundaries must be defined at the outlet level, not the geographic level, and reviewed whenever a new modern-trade account opens nearby.
Over-Extended Credit to Distributors
A distributor chasing a volume target will take on more stock than their sell-through supports, financed on extended credit from the manufacturer. This looks like healthy primary sales for a quarter or two, then collapses into a write-off when the distributor cannot pay or sell through the backlog. Credit limits should be set against demonstrated secondary sales run-rate, not order size.
Route-to-Market Checklist Before You Commit to a Model
Map outlet density and drop size by territory before assigning a model.
Set distributor credit limits against verified secondary sell-out, reviewed quarterly.
Put secondary-sales capture in place before scaling a distributor network, not after the first destocking surprise.
Draw territory boundaries at the outlet level, re-checked whenever a key account opens nearby.
Track weighted distribution and strike rate alongside numeric distribution.
Budget two to three quarters of coverage disruption into any territory conversion.
Final Word
There is no universally correct route-to-market model, only a correct one for a given territory's density, drop size, and credit risk. The FMCG networks that work well are unglamorous hybrids, run direct where the economics justify it and through distributors everywhere else, held together by secondary-sales visibility most companies build only after their first destocking scare. Build the visibility first.


Discussion0
Loading the discussion…