
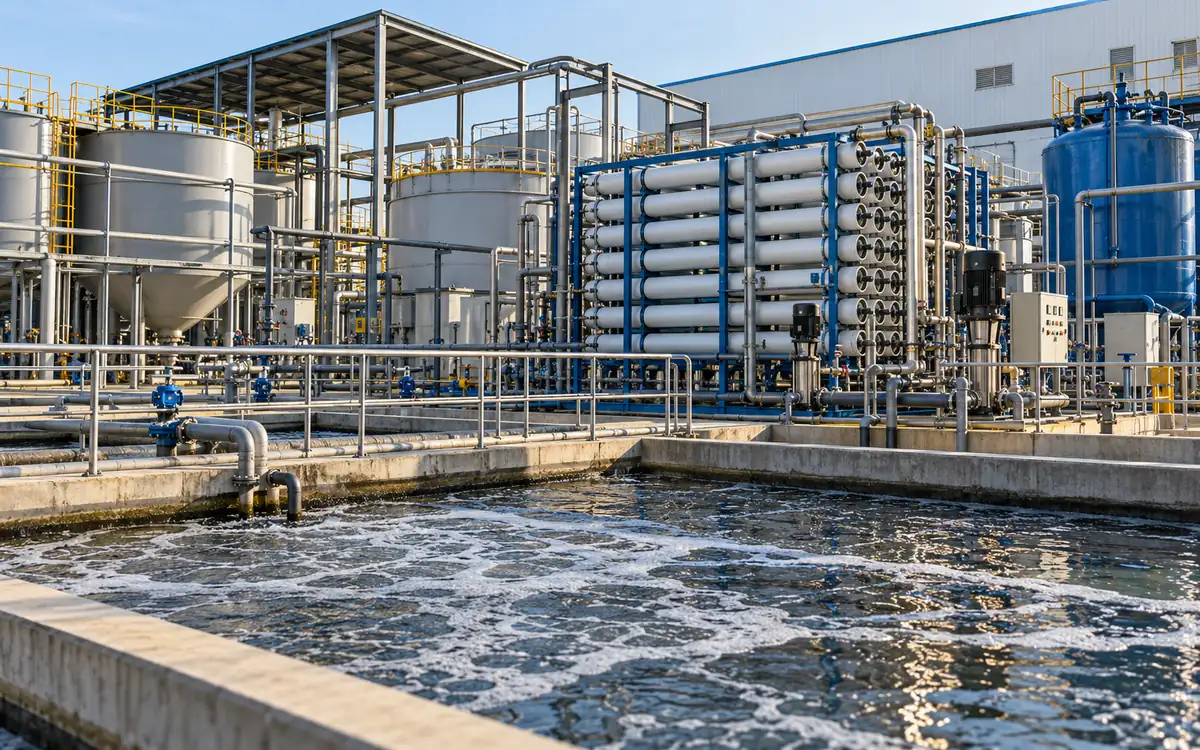
An effluent treatment plant cleans wastewater. A zero liquid discharge system has a wider aim. An ETP treats wastewater to achieve a defined outlet quality. A ZLD system sets a further limit. No industrial wastewater leaves the defined site as liquid discharge. A ZLD train may therefore include an ETP as its first major stage.
The useful comparison is between complete treatment routes. Follow the water, dissolved salts, organic matter, sludge, and other residues. Can each route meet the site’s needs? Check normal work, cleaning, and equipment failure.
This guide explains textile ETP vs ZLD through original, hypothetical examples. The values illustrate mass balances and cost logic. They are not design targets or vendor guarantees. They do not state discharge limits or national rules.
Begin with the required outcome
Write down where treated water may go. It may go to an approved discharge point. It may enter a central treatment plant or a factory reuse system. Each route needs its own quality, capacity, and operating basis.
Next, separate the site’s permit conditions from buyer requirements and voluntary programmes. Record the document, version, authority, and scope for each requirement. A treatment label is not proof. The proposal must meet the full set of needs.
The ZDHC Wastewater Guidelines, version 2.2 distinguish discharge routes and ZLD. They also state that conformance does not replace legal compliance. Use the applicable programme definition when making a programme claim.
For a Bangladesh project, check the current rules for that site. Ask the responsible authority and qualified advisers. Do not assume that all mills must use ZLD. Do not assume that a standard ETP is always enough. This article makes neither claim.
Define what each part of the system does
An ETP uses a group of treatment steps. These must suit the incoming waste and the required result. Screening can remove larger solids. Equalisation can smooth changes in flow and strength. Physical, chemical, and biological steps then address suitable pollutants.
Treatment does not mean every pollutant is destroyed. Some organic matter may be broken down. Some pollutants move into sludge. Dissolved salts may stay in the water. A suitable process must separate or remove them.
The IFC textile EHS guidance describes source segregation and several treatment options. It notes that the process and wastewater composition affect the required train. Its 2007 guidance provides technical context, not a substitute for current local requirements.
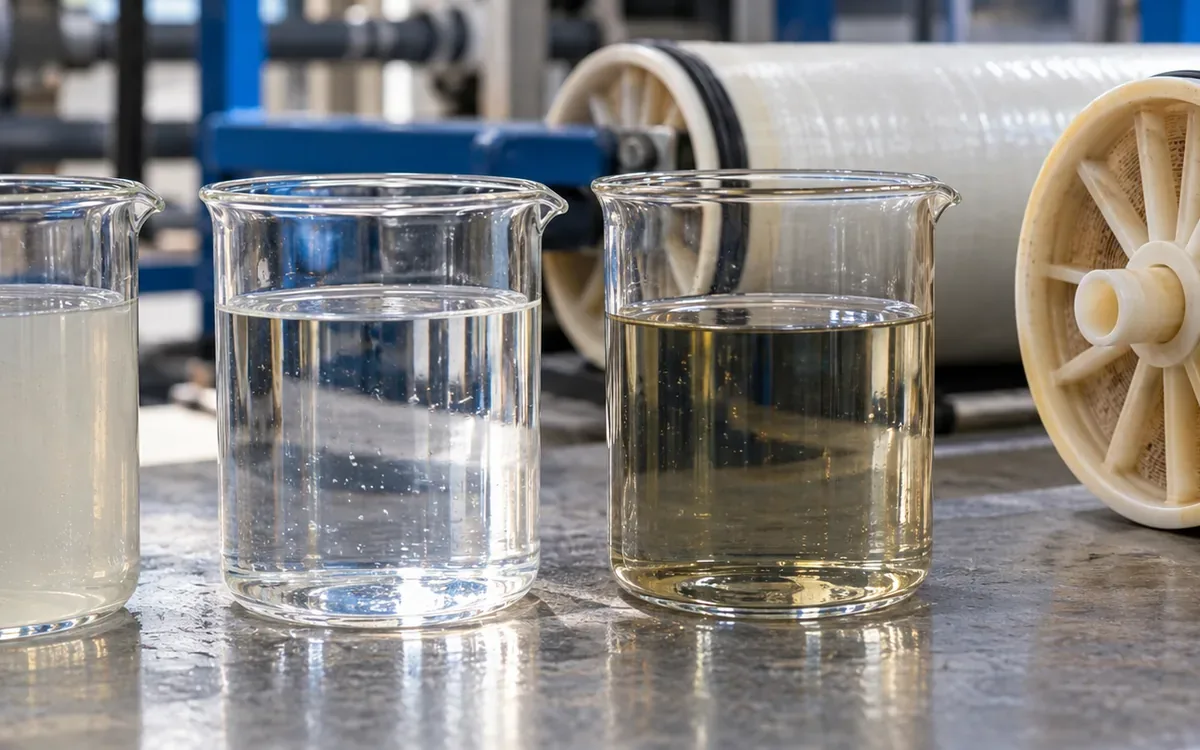
Water reuse adds a destination requirement. Water may suit a cooling system yet cause problems with pale shades. It may fail the needs of a final rinse too. Reuse treatment must match the receiving task, not merely produce a clear-looking sample.
Compare complete routes on the same basis
Route | Main objective | Stream still needing attention |
|---|---|---|
ETP with discharge | Meet outlet quality limits. | Treated water and sludge. |
ETP with some reuse | Recover useful water. Meet other outlet needs. | Reuse reject, discharge, and sludge. |
ETP and membranes | Split reuse water from concentrate. | Concentrate, cleaning waste, and sludge. |
Full ZLD route | Prevent industrial liquid discharge. | Recovered water, vapour, and wet solids. |
“Partial ZLD” is an unclear purchase specification. State the actual recovery fraction, liquid discharge quantity, and residue route instead. Check the defined discharge boundary. If liquid waste still leaves through it, high recovery alone does not make it ZLD.
Include every connected system in the comparison. A membrane skid without its pretreatment and concentrate route is an incomplete option. An evaporator without its energy supply and solids handling is incomplete too.
Test the real wastewater
Use samples from the main product groups and unusual loads. Pair them with flow records. A single sample taken after a light production day may understate the duty. Include dark shades, cleaning, recipe changes, and planned shutdown conditions where relevant.
Record flow, temperature, pH, and conductivity. Test suspended solids and the relevant organic and inorganic matter. Select additional tests from the actual chemicals and process risks. Conductivity is a useful trend, but it is not a complete chemical analysis.
Link the sample to the production record. Note which machines drained and what they made. State whether streams had already mixed. Preserve the sampling method, laboratory method, and reporting limits. A number without that context can be difficult to use for design.
Separate peak flow from average flow. Also separate hydraulic load from pollutant mass load. A larger equalisation tank can smooth some changes. It does not remove the daily salt or organic load. Treatment must still handle that load.
Convert concentration to a daily load
For a dilute stream, a practical mass-load equation is:
Load, kg/day = flow, m³/day × concentration, mg/L ÷ 1,000.
Take a hypothetical stream of 500 cubic metres per day. A measured dissolved constituent is present at 1,000 mg/L. Its daily load is 500 kilograms. Now save water and reduce flow to 400 cubic metres per day. Keep the same mass of that constituent. Its concentration rises to 1,250 mg/L.
The higher concentration does not mean the factory added more of that constituent. It reflects the smaller water volume. Treatment selection must consider both the concentration and the unchanged 500-kilogram daily load.
The opposite error also matters. Diluting a stream can lower concentration without reducing pollutant mass. Keep the load alongside the concentration when reviewing source controls or treatment performance. Do not present dilution as pollutant removal.
Use the appropriate measured constituent for the calculation. Total dissolved solids, chemical oxygen demand, and a specific metal describe different properties. These tests measure different things. Do not add their loads as if each measured a separate mass of the same substance.
Trace a membrane water and salt balance
Assume an RO feed of 100 cubic metres per day. It holds dissolved salts at 2,000 mg/L. The system produces 75 cubic metres per day of permeate at 100 mg/L. For this teaching example, assume a steady process. There is no storage change or other stream to include.
Feed salt load = 100 × 2,000 ÷ 1,000 = 200 kg/day.
Permeate salt load = 75 × 100 ÷ 1,000 = 7.5 kg/day.
Concentrate flow = 100 − 75 = 25 m³/day.
Concentrate salt load = 200 − 7.5 = 192.5 kg/day.
Concentrate salt concentration = 192.5 ÷ 25 × 1,000 = 7,700 mg/L.
Stream | Flow, m³/day | Salt, mg/L | Salt load, kg/day |
|---|---|---|---|
Feed | 100 | 2,000 | 200 |
Permeate | 75 | 100 | 7.5 |
Concentrate | 25 | 7,700 | 192.5 |
The membrane recovered 75% of the feed volume as permeate. It moved most salt into the concentrate. It did not destroy the salt. This volume balance is approximate for these dilute streams. Detailed design should use the required density and mass basis.
If permeate returns to production, its 7.5 kilograms of salt returns too. A whole-factory salt balance must include that internal loop. Reuse can build up salts. They need a suitable outlet to keep the chemistry stable.
Keep recovery and rejection distinct
Water recovery is permeate flow divided by feed flow. Salt rejection compares feed and permeate concentrations. State the basis used for that comparison. These percentages answer different questions.
In the example, water recovery is 75%. The simple inlet-based apparent salt rejection is 1 − 100 ÷ 2,000 = 95%. Neither figure means that 95% of the water is recovered. The salt mass reaching permeate is only 3.75% of the feed salt mass.
The DuPont FilmTec technical manual explains the effects of pressure, temperature, and recovery. It also shows how feed chemistry affects RO. It also covers scaling, fouling, and pretreatment. Use a design projection and suitable trials for the actual feed.
Do not select a higher recovery merely to improve a headline percentage. Check the concentrate chemistry, membrane limits, pressure, cleaning needs, and product-water quality. A short successful test may not reveal long-term fouling.
Extend the balance through concentration
Now suppose the 25-cubic-metre concentrate stream enters a further recovery stage. Use a simplified volume balance. This stage yields 20 cubic metres of condensate. It leaves 5 cubic metres of concentrated liquid.
Total recovered water is 75 + 20 = 95 cubic metres per day. Overall recovery is 95%. Adding the two stage percentages would be wrong. The second stage’s 80% recovery applies to 25 cubic metres, not to the original 100.
There is still a liquid outlet. Suppose that five-cubic-metre stream leaves as industrial liquid discharge. The example has not reached ZLD. Trace its water, salts, and other pollutants through the next step. Include any new treatment chemicals too.
The next steps may include evaporation and crystallisation. Solids separation may follow. Veolia’s crystalliser description places these units within a wider treatment route. Their suitability depends on the feed and the required product or residue.
Do not assume all evaporated water becomes clean reusable condensate. Check carryover and volatile constituents where relevant. Test the recovered stream against its intended use. Include vents, wash water, and cleaning streams in the design balance.
ZLD does not mean complete water recovery
A system can prevent industrial liquid discharge and still lose water. Water may leave as vapour or moisture in residues. The ZDHC definition allows these forms of water loss. It does not equate ZLD with recovery of every litre.
Report three water flows on separate lines. These are water returned for use, vapour losses, and water in wet solids. Also report any liquid outlet. This makes a claim much clearer than a single recovery number.
Draw the boundary around actual operations. Closing an outlet valve for a short time proves little. The plant must sustain zero liquid discharge. Check normal loads, cleaning, shutdowns, and faults. The system must handle each within its approved operating plan.
Account for salts and residues as real outputs
Salt enters in source water or chemicals. It must leave, build up, or take part in a reaction. A water balance alone cannot show which path it follows. Build separate balances for the major constituents that drive treatment or disposal choices.
Recovered salt is not automatically a saleable product. Mixed salts may contain colour, organics, metals, or other impurities. A possible customer needs a specification and a reliable quality record. Include testing and refining costs before assuming a sale value.
The Cascale wastewater guidance calls for tracking sludge quantity, composition, and disposal route. It also addresses shipment records and evidence of the final destination. Those records make the residue route reviewable.
Keep different residues separate where their properties require it. Biological sludge, chemical sludge, spent filters, and salt cake may need different handling. Confirm the classification and receiving route for each actual waste. A vendor’s generic disposal note is not enough.
Calculate wet residue from dry solids
Disposal and transport often depend on wet mass. Treatment calculations may use dry solids. State the basis in the cost sheet so the two are not confused.
Assume a residue contains 600 kilograms of dry solids per day. At 30% dry solids by mass:
Wet residue = 600 ÷ 0.30 = 2,000 kg/day.
Water in residue = 2,000 − 600 = 1,400 kg/day.
If the same solids reach 50% dry solids, wet residue becomes 1,200 kg/day. Water falls to 600 kilograms. The dry solids load remains 600 kilograms in both cases. Better dewatering removes more water. The original solid mass stays the same.
Account for the separated liquid. If it returns to treatment, it adds an internal hydraulic and pollutant load. Keep that liquid on the system diagram. A lighter waste truck does not remove it from the balance.
Reduce difficult loads before adding equipment
Review where salts, dyes, oils, and cleaning chemicals enter the drain. A small strong stream may deserve separate collection or treatment. Mixing it with a large cleaner stream spreads the load. This can make recovery harder.
Use production controls to reduce avoidable losses while preserving product quality. Confirm dosing, spills, bath handling, and cleaning practice. Keep the resulting change in the design feed data. Otherwise, a new plant may be sized for waste that a source control removes.
Do not move a strong stream to another drain just to improve an ETP result. The whole-site outlet still needs a proper route. Reduce or treat the load. Moving it outside the chosen spreadsheet does not solve the problem.
Before changing chemical storage or transfer arrangements, use ApparelDiary’s chemical compatibility guide. Waste segregation also needs a review of the actual mixture and handling hazards.
Match recovered water to a useful demand
Define the use of the water first. Then choose the final polishing step. Record the required conductivity, hardness, colour, organic content, and other relevant properties. Include variation and storage conditions, not just an average laboratory result.
The EPA water reuse guide explains how to match treatment to the intended use. It notes that industrial uses can require different water qualities. Treating every stream to the same high quality can add avoidable cost.
Check the daily demand profile. Recovered water may arrive when production stops. It then needs storage or another approved use. Do not claim an avoided fresh-water cost for recovered water that the site cannot use.
Measure water delivered to the receiving process. Water may leave the treatment meter and never reach a process. Cleaning, overflow, or pipe losses may consume it. The useful recovery figure should reflect the boundary stated in the business case.
Compare energy and operating costs fairly
Set one yearly output and wastewater case. Use it for all options. Use the same flow, chemistry, quality needs, and operating days. Ask each vendor to state exclusions and the conditions behind its guarantees.
Separate electricity from thermal energy. Electricity and delivered heat may both be stated in kilowatt-hours. Their prices and supply chains differ. Steam may supply the heat. Include its fuel and losses at the chosen boundary.
Include pretreatment, pumping, aeration, membranes, evaporation, cooling, and residue handling. Add chemicals, laboratory work, staff, spare parts, and planned replacements. Keep capital recovery separate from daily operating cost.
Assume a hypothetical comparison gives these annual costs and useful water recoveries. Every price is a teaching assumption, with no claim that it represents a market quote.
Item | Partial reuse route | Further concentration route |
|---|---|---|
Annual operating cost | $90,000 | $150,000 |
Useful recovered water | 60,000 m³ | 78,000 m³ |
Additional useful water | — | 18,000 m³ |
Additional annual cost | — | $60,000 |
Incremental operating cost per extra cubic metre = $60,000 ÷ 18,000 = $3.33.
This is not the total levelised cost because capital and other benefits are excluded. If avoided fresh-water cost is $0.80 per cubic metre, extra water alone is worth $14,400 per year. The remaining $45,600 needs other supported benefits or a required operating outcome.
Avoid giving compliance, supply security, or buyer access an invented cash value. Describe those needs clearly. Where a monetary value is used, show its evidence and scenario. Use ApparelDiary’s factory cash-flow guide for the later investment model.
Design for cleaning, downtime, and peak loads
A treatment train is limited by its weakest necessary stage. If a downstream unit stops, the upstream plant needs a defined response. Storage gives time, but space runs out. Stored water can also change in quality.
Assume a six-hour outage. Wastewater keeps arriving at 40 cubic metres per hour. At least 240 cubic metres of spare storage is needed. Add space for existing contents and operating margins. This simple calculation tests whether a proposed buffer is plausible.
The operating plan must also say what happens when that buffer fills. It may require production reduction or shutdown. An unplanned discharge is not a valid backup design. Set the response before commissioning.
Include cleaning wastes in the balance and treatment duty. Plan spare parts, service access, and staff coverage. Check how often the plant must stop to sustain high recovery. The factory must be able to manage those stops.
Make vendor guarantees comparable
Ask for a guaranteed feed envelope. State the flow range and chemical limits. The promised result applies within those bounds. A mill may run varied batches. A promise that covers only clean, stable feed may be of little use.
Define the product-water test point. Is it at the membrane outlet, after storage, or at the receiving process? State the quality limits, sampling method, and test period. Define useful recovery on the same boundary used in the cost model.
Request energy figures with their denominator. One energy figure may be per cubic metre of feed. Another may be per cubic metre of recovered water. These are not equal. At 75% recovery, 1.5 kWh per cubic metre of feed becomes 2.0 kWh per cubic metre of permeate. The equipment has not changed; the denominator has.
Ask whether the quoted figure includes cleaning, standby, and auxiliary loads. An evaporator’s power figure may omit heat supplied elsewhere. A membrane guarantee may exclude pretreatment. Put all exclusions into the common comparison sheet.
Agree how an acceptance test handles an out-of-range feed. The test should neither hide the issue nor unfairly blame equipment for an unstated duty. Record the condition and apply the agreed test rule. Include the route for failed-quality water during that test.
Finally, state who owns each interface. Several teams supply parts of the system. They include the civil, process, utility, and waste teams. Name one design lead who checks how those parts work together. That person must be accountable for the whole system.
Test the system as a full operating process
A pilot should cover the conditions that could change the decision. Test suitable feed variation, target quality, energy, chemical use, cleaning, and residue properties. State which results are measured and which remain projected.
Do not accept a short clean-water demonstration as proof of wastewater performance. Ask how the trial represents the planned plant and where scale-up remains uncertain. Have the design team explain those gaps in the guarantee basis.
At acceptance, verify flow meters, sample points, alarms, and diversion logic. Check the full water and constituent balances. Confirm the waste route and actual useful water delivery. Train operators using normal and upset scenarios.
Common mistakes in treatment comparisons
Mistake | Better check |
|---|---|
Clear water proves low salts. | Test the relevant chemical properties. |
Add recovery rates from each stage. | Use volumes on one feed basis. |
Call high recovery ZLD. | Trace every industrial liquid outlet. |
Assume recovered salt has resale value. | Check quality, buyer, and full recovery cost. |
Compare only skid prices. | Include civil works, utilities, storage, and waste handling. |
Ignore cleaning and downtime. | Test the full operating schedule. |
Frequently asked questions
Does a biological ETP remove dissolved salts?
Biological treatment addresses suitable biodegradable material. It should not be assumed to remove the salts that determine a reuse limit. Confirm the actual treatment mechanism and the measured salt balance.
Is RO alone a ZLD system?
RO produces permeate and concentrate. The concentrate still needs a route. RO can be part of a ZLD train. Having RO alone does not prove zero liquid discharge.
Can a factory install reuse equipment in stages?
Yes, if each stage has a complete approved operating route. Plan the future interfaces, capacity, space, and utilities early. Do not depend on a later investment to make the first stage workable.
Which option is best for every textile mill?
There is no single answer. Feed chemistry and outlet needs differ. So do water demand, energy supply, residue routes, and staff skills. Compare complete options using the site’s actual constraints and evidence.
Choose a route that closes every outlet
A sound ETP or ZLD choice follows water through the whole system. It follows pollutants too. Define the required outcome and test the feed. Calculate recovery on a clear basis. Give every residue a suitable destination.
Select the route that can deliver that outcome under real factory conditions. Choose a proposal whose claims can all be checked. Review its balances, costs, limits, and response to faults.
References
ZDHC Wastewater Guidelines, version 2.2, September 2024.
IFC: Environmental, Health, and Safety Guidelines for Textile Manufacturing, 2007.
DuPont: FilmTec Reverse Osmosis Membranes Technical Manual, revision 20, August 2026.
Veolia: Crystallisers for integrated ZLD treatment.
Cascale: Higg FEM 2025 wastewater guidance.
EPA: Integrating Water Reuse into the Clean Water State Revolving Fund, 2021.

Discussion0
Loading the discussion…