
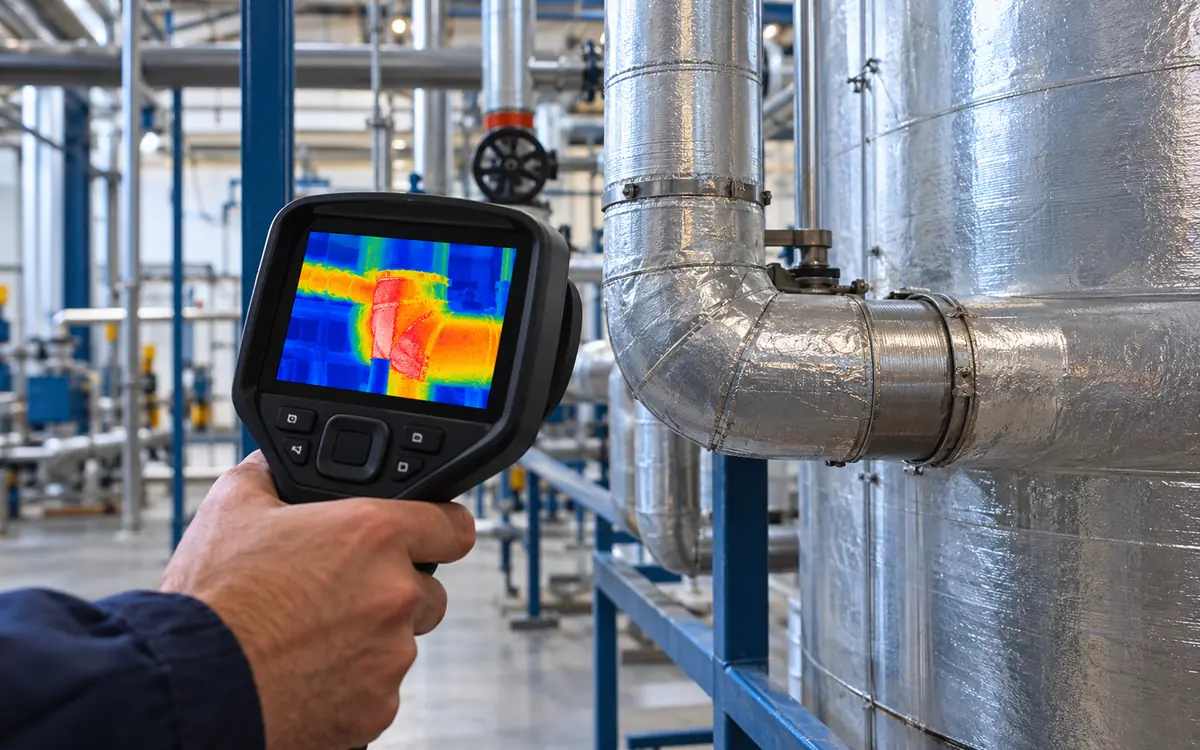
A bright patch in a thermal image is a reason to ask a better question. It is not a direct reading of wasted kilowatts. The patch may show a real hot surface, a reflection, or several small objects blended into one reading. Each case calls for a different response.
A useful thermal imaging factory energy audit links the image to a clear test. The auditor states what the camera can see. They check the surface and viewing conditions, then gather other evidence. Only then can the factory choose a repair or estimate an energy saving.
This guide focuses on that measurement task. It uses hypothetical textile factory examples. These show why false readings occur and how to check them. The numerical values are teaching assumptions. They are not camera specifications, fault limits, or promised savings.
Define the question before taking the image
Start with one asset and one decision. A hot water tank may need an insulation repair. A motor may need a closer inspection. A roof patch may need a moisture check. These are different tests, even when one camera serves them all.
Write a clear question: “Does this section lose more heat than a sound section?” Compare both under the same service. Then state which evidence would support an answer. For a tank, that may include the wall finish, fluid temperature, exposed area, and hours of use.
Separate a screening survey from a temperature measurement. A survey looks for patterns worth checking. A measurement assigns a value with stated conditions and limits. A survey image may not be a precise temperature record. Do not give its numbers more weight than they deserve.
ISO 18434-1 covers general procedures for machinery thermography. Its scope includes methods for reflected apparent temperature and emissivity. ISO 18434-2 addresses image interpretation and diagnostics. The public scopes help select a method. They do not set one alarm temperature for all factories.
For maintenance planning, use ApparelDiary’s guide to preventive and predictive maintenance. Here, the task is to judge whether a thermal reading can be trusted.
Understand what the camera receives
A thermal camera detects infrared radiation in its own wavelength band. Its software converts that signal into an apparent temperature. The conversion depends on the settings. It also relies on assumptions about the target and the viewing path.
The signal may include radiation from the surface and its surroundings. Air or a window can affect it too. The camera uses a different method from a contact probe. That method needs its own checks.
Nor does it see through an opaque machine casing. A warm bearing housing may provide a useful clue about the bearing. The image still shows the outer surface. The internal part may be hotter, and heat may travel from another source.
The FLIR measurement guide explains focus, range, and object size. It also covers the measurement settings. Treat these as part of the test setup. A sharp colour image alone does not establish a correct temperature.
In a factory report, label an uncertain value “apparent surface temperature.” Keep that label until the relevant corrections and checks support a stronger claim. This wording prevents a screening result from becoming an unsupported process limit.
Check emissivity before trusting a number
Emissivity describes how well a surface emits thermal radiation. It compares the surface with a blackbody at the same temperature. The value can depend on the wavelength band. Surface condition and viewing angle matter too. A handbook value for a material is a starting point, not proof for the actual surface.
A dull painted pipe and a polished fitting may look different on the camera. That can happen even when both are equally hot. They may emit and reflect very different shares of the radiation that reaches the camera. Visible colour alone does not settle that difference.
Record the actual finish. Note paint, rust, polish, oil, water, and scale. If an old reference image used a clean painted surface, compare it with the same kind of surface. A new shiny cover can break the comparison without any change in the process.
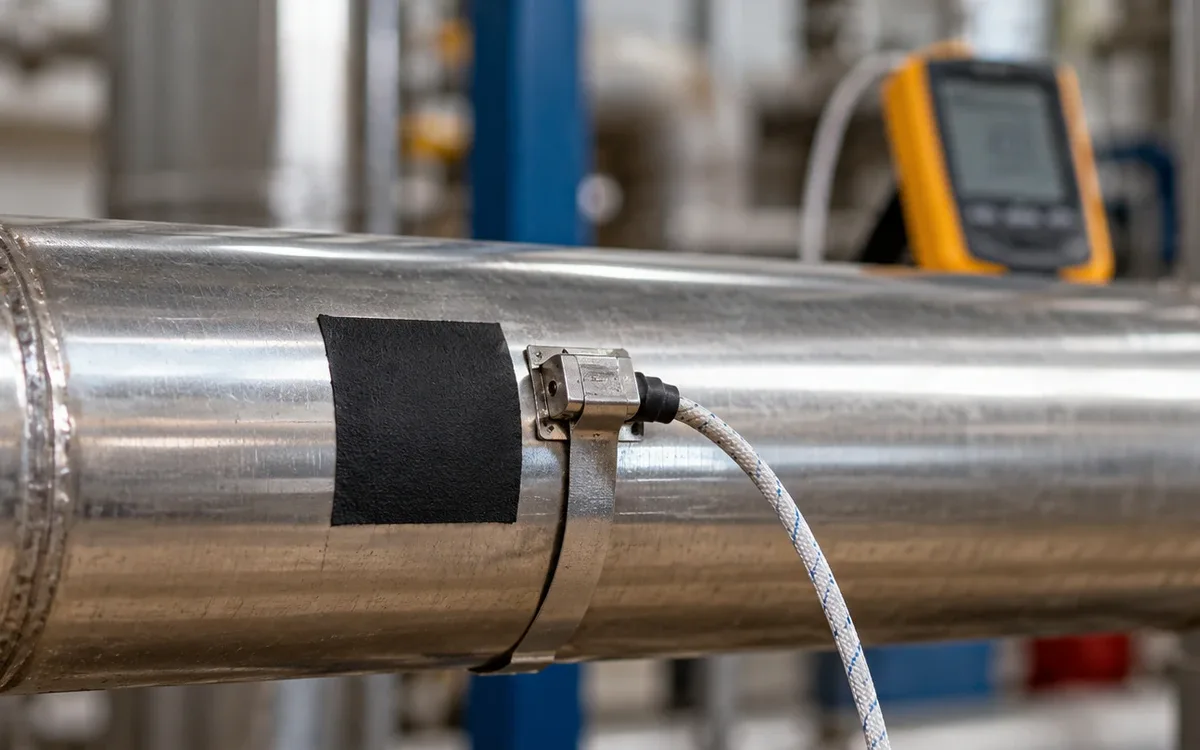
A trained person may use a known high-emissivity patch as a reference. This must be safe and suitable for the job. The patch must suit the temperature and surface. It must reach thermal balance with the target. Adding tape or paint to live or moving equipment is not part of a casual camera survey.
The FLIR thermography reference discusses these corrections and the limits of the measurement. Use the approved procedure for the actual camera and target. Do not adjust emissivity to get the answer you expect. The setting must have a sound basis.
Reflected apparent temperature is a separate input
A hot dryer, a cold roof, or the operator can reflect from a shiny target. Changing the camera angle may change the apparent hot patch. That is evidence to investigate a reflection. It is not a universal test that rules every reflection in or out.
Reflected apparent temperature describes the surrounding radiation as seen by the target. It is not necessarily the air temperature beside the camera. A contact thermometer in the room does not directly measure that radiation field.
Consider a polished valve beside a hot process vessel. One view shows 74°C and another shows 49°C. These hypothetical readings do not prove that the valve cooled by 25°C. The changed view may have altered the reflected signal.
Keep the process stable while checking the observation. Record both views, the nearby hot surface, and the valve finish. Seek a suitable reference point or another approved temperature method. If the cause remains unclear, report a suspected reflection and request a better test.
Fluke’s guidance on reflective targets discusses these surface issues. It explains why emissivity checks matter. Its practical lesson is to control the measurement conditions. No single default setting can make every metal surface reliable.
Match target size to measurement resolution
The total number of image pixels does not tell you the smallest object that can be measured at any distance. Lens choice and distance affect the area seen by each pixel. The camera also needs a large enough target for its specified measurement spot.
For a small angle, a geometric estimate is:
Pixel width at target ≈ distance × instantaneous field of view.
Use radians for the angle. In a hypothetical setup, the instantaneous field of view is 1.5 milliradians. The distance is 3 metres:
Pixel width ≈ 3 × 0.0015 = 0.0045 metres = 4.5 millimetres.
Now assume a specific camera method. It needs a target at least three pixels across. The required width is about 13.5 millimetres. This three-pixel rule is an example assumption, not a specification for all cameras.
An 8-millimetre connector would be too small for that setup. Its image could blend with the cooler background and understate the peak. Digital zoom enlarges the display. It cannot recover detail that the lens and detector never captured.
Use a suitable lens or an approved safer viewpoint. Never shorten the working distance at the expense of the required safety clearance. The Bureau of Reclamation manual explains spatial detail and measurement spot size. It also explains why target size and distance belong in the record.
Keep focus, scale, and range separate
Focus controls whether the target detail is sharp. A blurred image mixes signals across edges. Poor focus loses information during capture. Software cannot restore it all. Check focus on the actual target, not just on a nearby wall.
The camera’s measurement range must cover the temperatures of interest. A saturated reading is not a valid peak estimate. Record a change in range if it affects the comparison. Note any effect on measurement quality.
Level and span control how colours map to temperatures. A narrow display span can make a small difference look dramatic. A broad span can hide it. The palette is a visual aid, so colour intensity should never be used as an energy scale.
For before-and-after figures, use a common display scale when practical. Also show the numerical range. Keep the original radiometric files where the instrument provides them. A compressed image pasted into a report may lose the settings needed for later review.
Record the operating state
A motor at light load is not a fair thermal match for the same motor at full load. A tank just filled with hot water differs from a tank that has been steady for an hour. Record enough process data to explain the state during the scan.
Record the asset ID, time, running state, and load. Add surface finish, distance, and viewing angle. Add air temperature, wind, recent rain, and sun exposure where relevant. Note nearby heat sources that may affect reflection or heat flow.
For electrical equipment, follow the site’s approved work process. Obtain load data through that process. For pumps, note duty and flow where available. For hot process equipment, record the normal temperature reading. Note whether the unit is heating, holding, or cooling.
The DOE operations and maintenance guide includes thermography as a diagnostic tool. It stresses proper use and trained users. Apply that principle to the job record. The image is one piece of evidence. Its operating context matters.
Choose supporting checks for the suspected cause
Different faults can create similar surface patterns. A damp wall may be cool from evaporation. An air jet may also cool a wall. A dark surface can warm in the sun. A useful follow-up test separates these explanations.
Observation | Plausible explanation | Useful next evidence |
|---|---|---|
Warm patch on insulated vessel | Missing insulation or a thermal bridge | Surface condition, construction detail, safe inspection |
Cool roof patch | Moisture, shade, or recent wetting | Weather history and suitable moisture checks |
Hot electrical connection | Extra resistance, load, or reflection | Approved load and electrical condition assessment |
Warm bearing housing | Friction, load, or nearby heat | Vibration, lubricant condition, operating duty |
Uneven duct surface | Insulation change or air distribution | Air readings and physical inspection |
The table is a set of test options, not a fault diagnosis. A moisture meter also has limits that depend on the material and method. A contact probe needs good contact and a safe test location. Two weak readings do not automatically become strong evidence when combined.
Choose the cheapest sound check that can change the decision. A safe inspection may confirm a missing insulation cover. A complex model may add little to that repair decision.
Why a hot spot does not reveal wasted power
Temperature and heat flow are related, but they are not the same quantity. Heat loss depends on area, heat transfer conditions, and the temperature difference. Some equipment must run warm to do useful work.
Consider a hypothetical flat surface of 2 square metres. Its corrected surface temperature is 65°C. Nearby air is 25°C. If an engineer assumes a convective heat transfer coefficient of 8 W per square metre per kelvin:
Convective heat loss = h × A × temperature difference.
Heat loss = 8 × 2 × (65 − 25) = 640 W.
This is only the modelled convection term. It excludes radiation and other paths. If the true coefficient were 4 or 12, that term would be 320 or 960 W. The same surface temperature could support a wide range of estimated losses.
Even a sound total heat-loss estimate does not directly equal fuel savings. The process schedule, useful heat demand, and heating system efficiency also matter. A repair may change the surface temperature. It may also change the heat transfer coefficient.
Use thermal images to locate and describe the issue. Use a suitable engineering model and measured operating data to estimate energy. Then compare the estimate with post-repair meter data under a stated boundary.
Electrical heat needs a separate risk decision
For a resistive connection, local electrical loss can be expressed as P = I²R. Use a hypothetical current of 100 amperes and a resistance of 0.002 ohm. The result is 20 W. At 200 amperes, the same resistance produces 80 W.
That calculation explains why load matters. It does not allow an auditor to infer resistance from a thermal colour. Heat spreading and airflow also affect the surface temperature. So do enclosure design and time at load.
A small energy loss may still signal an urgent reliability or safety issue. Do not rank electrical defects only by annual energy cost. The factory’s qualified electrical team should assess the condition. They should use the equipment limits and the approved risk process.
Fluke’s hot-spot guidance describes useful heat patterns. These can help locate possible connection problems. Use the pattern to direct inspection. It does not establish the cause without further evidence.
A thermal camera is non-contact, but opening a live enclosure is still electrical work. Follow site access rules and qualified procedures. Use approved inspection windows where suitable, with the correct transmission information. Ordinary glass cannot be assumed transparent in the camera’s infrared band.
Build uncertainty into the decision
The instrument’s accuracy specification is only one source of uncertainty. Surface assumptions, reflections, target size, focus, and unstable load can matter more. Report those limits where they affect whether the proposed action is justified.
Suppose a surface reads 61°C with an estimated overall uncertainty of ±4°C. A documented equipment limit is 60°C. The reading does not cleanly prove compliance or exceedance. Apply the site’s agreed decision rule. Get a better reading if the decision has major consequences.
Do not reduce uncertainty by rounding 61°C to a convenient number. Keep the original data. Explain what would reduce doubt. It may be better surface data, a safer closer view, or a stable load. A suitable reference method may also help.
Relative readings can reduce some common errors. This works only when the targets are comparable. Two different surface finishes can defeat a phase-to-phase or component-to-component comparison. Write the comparison basis beside the reported temperature difference.
A worked audit-to-repair example
Consider a hypothetical hot rinse tank. An auditor finds a warm strip beside a removable cover. The strip looks brighter than the rest of the tank. The initial image suggests a place to inspect; it does not yet show annual savings.
The team checks the finish and finds the strip and nearby wall use the same paint. It records the tank’s operating state and repeats the scan from a suitable angle. The pattern remains. During a safe shutdown, inspection finds a damaged insulation section.
The engineer measures the exposed area. They estimate its heat loss under normal service. The estimate gives a 0.9 kW reduction after repair. At an assumed 3,000 operating hours, avoided heat is 2,700 kWh per year. Those figures are project assumptions for this example.
Assume the heating system delivers useful heat at 80% efficiency. Estimated avoided fuel input is 2,700 ÷ 0.80 = 3,375 kWh per year. Use a consistent fuel energy basis. Do not multiply by efficiency or treat heat saved as electricity saved.
After repair, the team repeats the surface check under similar service. It also reviews process and fuel data. A cooler outer surface supports the repair finding. The fuel record tests the predicted energy benefit. Use the chosen measurement boundary for that check.
For that later business review, use ApparelDiary’s capital project review guide. Keep the repair evidence and the energy claim distinct in the project file.
Write a report that another person can challenge
Each finding should state the asset, question, observation, possible cause, and next action. Include the thermal image and a matching visible view in the working report. Identify the exact component so a maintenance team can find it without guessing.
Record settings and conditions beside the result. Name the camera and lens, calibration status, surface assumptions, distance, load, and time. Preserve the original file. State whether the finding is a qualitative pattern or a supported temperature measurement.
Assign a responsible person and a due date for the next check. Use an explicit status such as “investigate,” “repair approved,” or “verification complete.” An image marked only “hot” leaves both the risk and the required action unclear.
Plan a route that can be repeated
Build the inspection route around useful operating states. A scan during a meal break may miss equipment that is normally loaded. A scan during startup may capture a brief warmup pattern. Choose the state that answers the audit question and note exceptions.
Give each view an ID. Describe the asset side, camera position, and area of interest. A marked safe viewing point can help later surveys use the same distance and angle. Keep the visible photo broad enough to show where the small thermal target sits.
Include normal comparison points. Save more than suspected defects. A later reviewer also needs to see what normal service looked like. Record comparable sound surfaces under the same duty. State any differences in material or finish.
Log inaccessible assets as uninspected. Do not quietly count them as satisfactory. The route record should show what was checked, what could not be checked, and why. This makes the survey scope clear. Production staff and contractors can see what it covered.
Specify the survey before hiring a contractor
A useful scope states the assets, questions, operating windows, and deliverables. Ask who will interpret the images and what experience they have with those assets. Training in building surveys alone may not cover the electrical or process task at hand.
Agree how the contractor will handle unsafe access, uncertain surfaces, and unresolved findings. Require the original measurement files where available, plus the settings and operating notes. A colourful PDF with no raw record is hard to review after the contractor leaves.
Define how a result becomes a work order. The contractor may identify a suspected issue. The factory’s engineer may approve the repair. Agree who checks the completed work and which evidence closes the finding. This prevents the survey from ending as a folder of images with no clear owner.
Common problems and practical responses
Problem | Response |
|---|---|
Hot patch moves with the viewing angle | Investigate reflections and surface properties |
Small part reads close to its background | Check measurement spot size and focus |
Before and after images look very different | Compare display scales, load, and weather |
Corrected temperature changes greatly with settings | Improve the input evidence before claiming precision |
Wet area is labelled as a leak | Confirm moisture and locate its source |
Savings estimate comes only from image colour | Build a heat-flow model and measurement plan |
Frequently asked questions
Can thermography measure temperature through insulation?
An ordinary surface survey measures the outer surface of the insulation or jacket. That pattern may reveal a defect. It does not directly measure the hidden pipe wall or fluid. Use other process readings when those temperatures matter.
Does a sensitive camera guarantee an accurate reading?
No. Thermal sensitivity describes the ability to distinguish small temperature differences under stated conditions. Accuracy, focus, target size, and surface corrections are separate issues. Choose the instrument for the actual task.
Is one temperature limit suitable for every factory asset?
No. Equipment design, material limits, duty, load, and failure consequences differ. Use the relevant equipment guidance and an approved site decision process. A general internet threshold should not replace those limits.
Can a camera confirm an energy saving after repair?
It can support the evidence that a thermal condition changed. An energy-saving claim needs a defined boundary. Use a suitable model or meter comparison. Match the process conditions before drawing that conclusion.
Make the image the start of the evidence trail
A sound thermal audit turns a pattern into a testable finding. It controls surface assumptions, reflections, resolution, and operating state. It then connects the image to the evidence needed for a practical decision.
Make the decision clear. Inspect, repair, measure again, or leave the asset in service with a stated reason. Colour is useful for finding the question. Good measurement and engineering provide the answer.
References
ISO 18434-1: General procedures for thermography in condition monitoring.
ISO 18434-2: Image interpretation and diagnostics.
FLIR: Thermographic measurement guidance.
FLIR: Thermography reference document.
Fluke: Handling thermographic reflectivity.
Bureau of Reclamation: Thermal Analysis, FIST Volume 4-13.
U.S. Department of Energy: Operations and Maintenance Guide, diagnostic technologies.

Discussion0
Loading the discussion…