
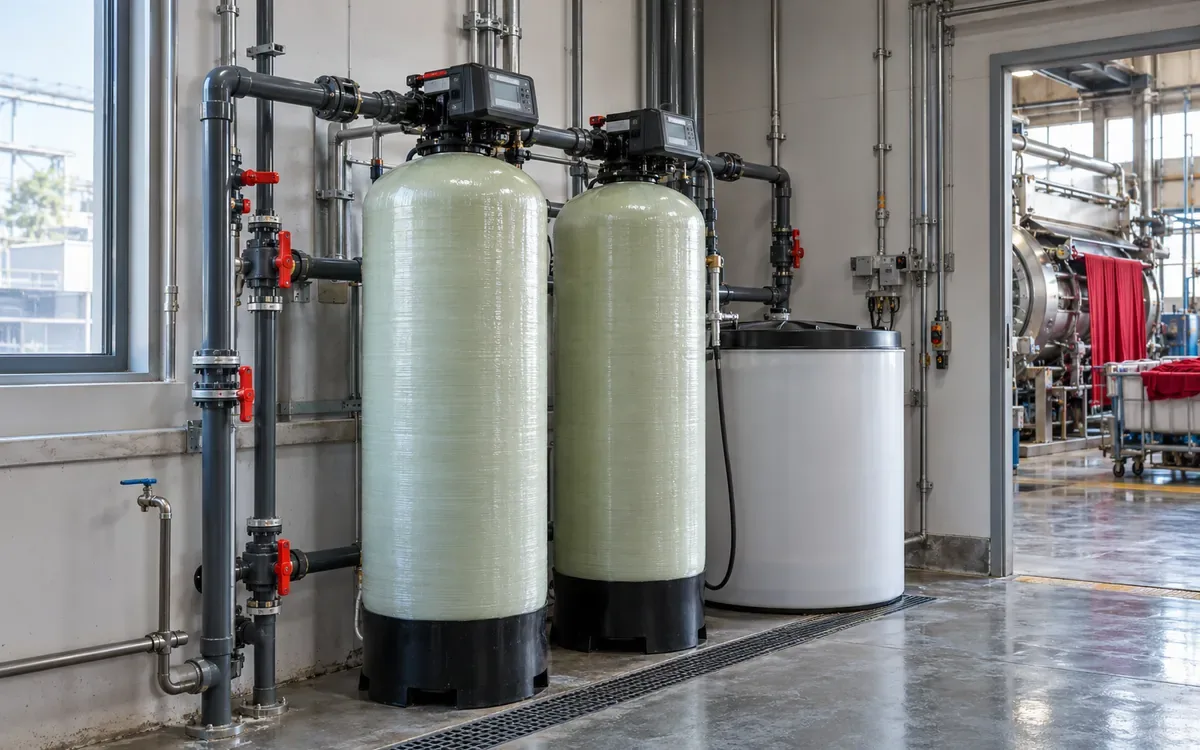
A dyehouse needs water that meets the needs of its process at the time of use. A clear sample and a normal pH reading do not establish that. Water can carry calcium and magnesium without looking dirty. A softener may deliver suitable water in the morning. Hardness can break through later in the same shift.
The useful question is therefore more specific than “Is our water soft?” Which supply fed the batch? What did the team measure, and when? Could the test detect the agreed limit? Connect those answers to softener flow and regeneration records. These facts help the utilities team and dyehouse trace the cause together.
This guide covers hardness control for textile process water. It explains sampling and units. A worked example shows how to calculate softener loading. The numerical limits and costs in the examples are hypothetical. Set production limits with the process technologist, chemical suppliers and water-treatment designer.
Understand what the hardness result represents
Water hardness is mainly associated with dissolved calcium and magnesium. The US Geological Survey explains hardness and its effects, including deposits that can form when hard water is heated. Its general labels such as soft or hard describe water. They do not establish acceptance limits for a pale shade, an enzyme bath or a particular machine.
Labs commonly report total hardness in milligrams per litre as calcium carbonate. The unit is written mg/L as CaCO3. This is a common equivalent basis. It does not mean the sample contains that mass of solid limestone floating in each litre.
Keep the words “as CaCO3” with the result. A calcium result of 40 mg/L as calcium is different from 40 mg/L as CaCO3. Check which basis each report uses. Numbers on different bases cannot be compared directly.
A useful water report names both the measured property and the reporting basis. “Hardness 15” is incomplete. “Total hardness 15 mg/L as CaCO3 by the named laboratory method” gives the reader a result that can be interpreted.
Separate hardness from the other water checks
A factory may have a pH meter, a conductivity meter and a hardness kit on the same bench. Each answers a different question. Using one test in place of another leaves gaps in the control plan.
Property | Main question it addresses | What it cannot establish alone |
|---|---|---|
Total hardness | How much hardness is present on the stated equivalent basis? | Colour, iron content or total dissolved salt |
pH | What is the acid or alkaline condition at measurement? | The amount of hardness or acid-neutralising capacity |
Alkalinity | How much acid-neutralising capacity is measured by the method? | The calcium and magnesium content |
Conductivity | How strongly does the sample conduct electricity under the stated conditions? | Which dissolved ions caused the reading |
Iron or manganese | How much of the named metal was found? | The full suitability of the water for a process |
USGS defines alkalinity as a measure of acid-neutralising capacity. That explains why two waters with similar pH can respond differently when acid is added. Their starting pH values do not tell the whole story.
In the same way, a stable conductivity trend does not prove stable hardness. A change in the mixture of dissolved ions may leave conductivity near its previous value. Use conductivity to track changes. Then test each property named in the process specification.
Know what a sodium softener changes
A sodium-cycle ion-exchange softener replaces calcium and magnesium ions with sodium ions. It is a selective treatment rather than a way to remove every dissolved substance. DuPont's water-conditioning manual explains this exchange and the factors used in softener design.
This distinction matters when a team sees low hardness but still has a process-water problem. A softener result does not cover every water-quality limit. Iron, organic matter and alkalinity still need their own checks. Those needs must be addressed by the complete treatment system.
Do not promise that a softener will reduce conductivity to nearly zero. Water still contains dissolved ions after sodium exchange. Demineralisation and reverse osmosis involve different treatment duties and equipment. The correct choice depends on the water analysis and the process requirement.
For the dyehouse, the practical action is to keep a short water specification by use. Dyeing make-up water and final-rinse water may need different controls. Boiler feedwater has its own needs, too. A result approved for one duty does not automatically release water for all three.
Put the reporting units on one basis
A lab report may list calcium and magnesium as separate elements. Their approximate contribution to hardness can be expressed on a CaCO3 basis:
Total hardness, mg/L as CaCO3 = 2.497 × calcium, mg/L + 4.118 × magnesium, mg/L.
The factors convert the two divalent ions to an equivalent calcium-carbonate mass. The calculation assumes these are the hardness constituents being counted. It is not a correction for every possible interference in a chemical test.
Suppose a hypothetical laboratory report gives calcium at 40 mg/L and magnesium at 12 mg/L, both as the elements:
Calcium contribution = 40 × 2.497 = 99.88 mg/L as CaCO3.
Magnesium contribution = 12 × 4.118 = 49.416 mg/L as CaCO3.
Calculated total = 149.296 mg/L as CaCO3, or about 149.3 mg/L.
Adding 40 and 12 to report hardness as 52 mg/L would mix the wrong basis into the conclusion. Keep the original element results and the converted total in separate columns.
Some plant records use ppm. For dilute water with density close to 1 kg/L, ppm by mass and mg/L are close numerically. State the actual basis instead of relying on that shortcut for concentrated liquors or chemical stocks.
Choose a test that can resolve the release limit
A test that measures raw water well may be unsuitable for checking a very low softener outlet limit. Check the test range and the size of change it can detect. Review known interferences and measurement uncertainty, too. A result displayed as zero may mean only that the test did not resolve a small amount.
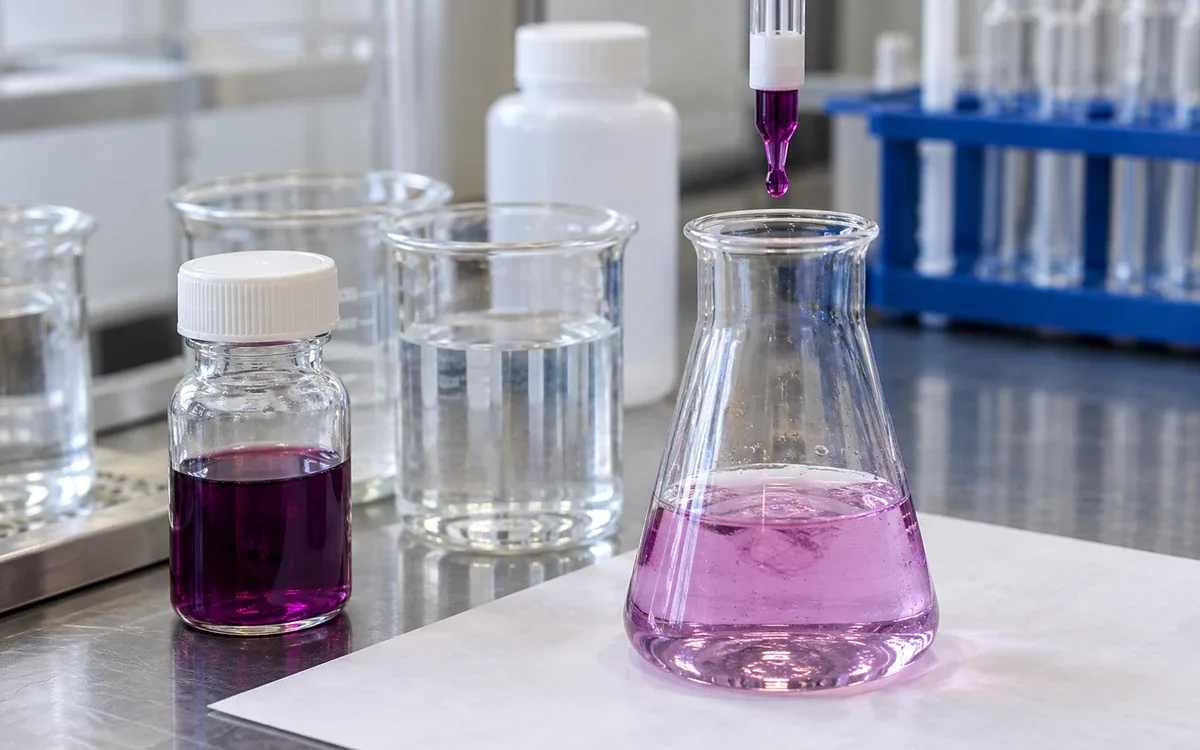
Hach Method 8329 is a sequential EDTA method. It reports calcium hardness and total hardness on the same CaCO3 basis. Subtract calcium hardness from total hardness to obtain magnesium hardness. Its stated range begins at 10 mg/L. That scope should be checked before selecting it for an outlet requirement below that range.
Hach also lists a calmagite method with a 0.05–4.00 mg/L range. This illustrates why low-level checks need a suitable method. The stated range alone does not show a lab's measurement uncertainty.
For example, imagine a plant limit of 2 mg/L. In the kit being used, one drop represents 10 mg/L. One drop spans five times the limit. Reporting “less than one drop” cannot establish compliance at 2 mg/L. Select a validated procedure that supports the required decision.
Make the sample location part of the result
Give each sampling point a fixed name. At a minimum, consider the raw supply, each softener outlet, the common storage tank and a representative point of use. Additional points may be needed after blending or at a suspect branch.
The sampling plan should show how to take a sample that represents each point. Follow the laboratory method for containers, flushing, handling and any preservation. Do not improvise acid additions at a production tap. Some tests need different sample handling, so one bottle may not suit every analysis.
Record the time, source, operating bed and flow condition. Add the cumulative volume since the last completed regeneration. A result without this context can confirm a problem but leave its location unknown.
For a two-bed system, “soft water sample” is too vague. It may refer to bed A, bed B, mixed tank water or a process tap. The tag should let another person trace the route. They should not need to ask who collected it.
Read a small sampling map before changing the machine
Consider this invented set of simultaneous results. All values use one suitable method and are reported as mg/L as CaCO3.
Point | Hardness result | Immediate investigation |
|---|---|---|
Raw water | 180 | Confirm the feed loading basis |
Bed A outlet | 1 | Review against its release limit |
Bed B outlet | 22 | Investigate this bed and its operating record |
Common tank | 9 | Check which streams entered and when |
Dyehouse tap | 9 | Compare with the tank and distribution route |
The map directs attention to bed B. It does not prove the cause. The bed could be exhausted. Poor regeneration, a valve fault or another issue could also explain it. Preserve the records before making several changes at once.
A different map would lead elsewhere. Suppose both bed outlets pass but the tank fails. Check mixing, bypasses, tank contents and sample identity. If the tank passed but a distant tap failed, investigate that branch. Retesting only the easiest outlet would miss the distinction.
Calculate hardness loading from water volume
Concentration becomes more useful for operations when it is paired with flow. Hardness load measures the equivalent mass entering the softener over a defined period:
Hardness load, kg as CaCO3 = water volume, m3 × hardness, mg/L ÷ 1,000.
One cubic metre contains 1,000 litres. A concentration of 1 mg/L equals 1 g/m3. Multiply the concentration in g/m3 by the volume in m3 to find grams. Divide by 1,000 to find kilograms.
At a hypothetical feed hardness of 180 mg/L, treating 100 m3 introduces 18 kg of hardness equivalent. Treating 200 m3 introduces 36 kg. The resin must handle twice the load. Yet the measured concentration has not changed.
Now raise feed hardness to 240 mg/L while keeping the daily volume at 200 m3. The load becomes 48 kg. A plan based only on the calendar may miss this rise. The softener may reach its working limit earlier.
Keep the term equivalent mass in the calculation. The 48 kg is a chemical reporting basis, not a prediction that exactly 48 kg of solid scale will form in the factory.
Use working capacity rather than a catalogue maximum
Assume a softener has a validated usable capacity of 40 kg as CaCO3. This applies under its current conditions. The plant uses a hypothetical 10% operating reserve. The load allowed before its planned switch is therefore 36 kg.
At 180 mg/L feed hardness, planned volume = 36 × 1,000 ÷ 180 = 200 m3.
At 240 mg/L, planned volume = 36 × 1,000 ÷ 240 = 150 m3.
At a steady flow of 20 m3/h, these volumes correspond to 10 hours and 7.5 hours. The second run is 2.5 hours shorter. The example shows why feed changes should reach the softener control plan promptly.
The assumed reserve is not a design recommendation. A real system needs its validated capacity, leakage endpoint and approved control logic. Capacity depends on more than resin volume. A throughput calculation does not replace outlet testing.
DuPont's recommended operating conditions stress that resin performance data apply within defined conditions. Use the equipment designer's basis for the actual resin and vessel. Do not apply another system's capacity merely because both tanks have the same diameter.
Check blending and storage with a mass balance
Suppose a tank receives 18 m3 of water at 1 mg/L hardness and 2 m3 of raw water at 180 mg/L. Assume complete mixing, no reaction and additive volumes. The expected mixed hardness is:
Mixed hardness = [(18 × 1) + (2 × 180)] ÷ 20 = 18.9 mg/L as CaCO3.
Only one-tenth of the volume came from the raw source, yet it dominates the hardness result. This makes unintended bypass flow worth investigating. A sound softener cannot protect a tank if untreated water enters downstream.
For a real tank, record starting inventory and inflows before using this balance. A partially filled tank may still contain water from an earlier event. Samples taken before full mixing can differ, too. The calculation predicts a defined mixture. Actual readings can vary with the place and time of the sample.
Avoid using blending as an informal rescue. It changes the supplied water and may leave other properties outside their limits. Any approved blend needs a defined source, ratio, mixing method and verification plan.
Investigate breakthrough in a useful order
Start by confirming that the result belongs to the expected sample. Then review the measurement controls. A stale reagent can create a false alarm. So can the wrong sample volume or a missed unit conversion. Do not dismiss a true high result because production is busy.
Next compare the treated volume and feed hardness with the validated run. If the load rose, the available capacity may have been reached earlier. If it did not, check the regeneration record and operating configuration with the utilities team.
Look for evidence of actual brine delivery and completed rinse stages. A timer showing “regeneration complete” records a control sequence. It does not by itself prove that the intended liquid reached the resin. Use the equipment's approved checks to establish what happened.
Other investigations may include valve positions, bypass leakage, unusual flow, pressure changes, fouling or resin condition. Their order should follow the system's history and design. Do not open a pressure vessel or change chemical handling steps simply to complete a quality checklist.
Record the suspected cause separately from the confirmed one. “High outlet hardness” is an observation. “Insufficient regeneration” becomes a cause only when the evidence supports it. That distinction makes the next maintenance decision more reliable.
Keep laboratory controls visible
Record the method and reagent lot in the water log. Add the instrument or kit identity and the required quality-control results. Use blanks, reference material, duplicates or recovery checks as required by the validated method. Keep original observations as well as calculated results.
Hach's total-hardness method describes EDTA measurement and identifies potential interferences. Coloured, chemically treated or metal-rich samples may need special review. A procedure suitable for clean feedwater should not be assumed suitable for a dye bath.
Consider two example duplicate results of 1.2 and 1.4 mg/L. They may fit the lab's established precision. Results of 1.2 and 7.8 mg/L call for investigation before averaging. Follow the method's quality system. Do not invent a rule after seeing the values.
Use language that reflects the test's capability. “Below the reporting limit of the stated method” is more useful than “zero hardness” when zero has not been established. Record the limit and units beside the statement.
Connect the water event to the affected batches
When a failure is confirmed, identify its time window. Find which production lots used the affected supply. Tank volume, inflow and machine-fill records help define that window. A laboratory result at noon does not establish the exact minute when breakthrough began.
Hold or review the affected material under the factory's procedure. Assess the product with the checks relevant to its route. Do not assume every lot is defective. A later passing water sample does not release all earlier lots, either.
ApparelDiary's reactive dyeing guide places water results alongside preparation and dosing records. Its liquor-ratio calculation guide helps establish the actual water and chemical bases. Those records help the team trace the water problem. A general note about poor shade gives much less detail.
Do not let a removal percentage hide an outlet failure
Removal percentage can describe the difference between a paired inlet and outlet result. It does not replace the required outlet concentration. For a simple concentration comparison on a matching basis:
Hardness reduction = (inlet hardness − outlet hardness) ÷ inlet hardness × 100.
Suppose inlet hardness is 180 mg/L and outlet hardness is 3 mg/L. The reduction is 177 ÷ 180 × 100 = 98.33%. If this fictional process requires an outlet no higher than 2 mg/L, the water still fails. A large reduction is not the same as a compliant final concentration.
Now suppose another run changes 20 mg/L to 1 mg/L. Its reduction is smaller, at 95%. Yet its outlet meets the same assumed concentration limit. Ranking these runs by removal percentage alone would give the wrong release decision.
Use paired samples from the same operating period. The flow rates must also be comparable. Check that the inlet value is large enough for a useful comparison. If the inlet approaches the method's reporting limit, the percentage becomes unstable and may be misleading. Keep the measured concentrations visible.
Match the checking interval to the production exposure
A fixed morning sample may miss a short run that reaches its endpoint in the afternoon. Use the plant's history and treated volume to set the checking plan. Consider source changes and the harm a missed failure could cause. Increase attention around conditions known to change the supply, under the approved plan.
For a teaching example, a 20 m3/h line can deliver 40 m3 between checks made two hours apart. If the later check fails, this volume may need review. That does not prove all 40 m3 was unsuitable. Tank mixing and the unknown start time of the failure affect the investigation.
Record the last confirmed suitable result and the first unsuitable one. Add the actions taken between them. Where an online analyser is used, retain its validation and alarm history. Continuous readings are valuable only when the instrument and response system work as intended.
Compare operating cost per usable cubic metre
Track salt, regeneration water, testing, maintenance and any rejected water on one consistent boundary. A lower salt bill is not an improvement if it causes frequent off-spec supply or more repeat processing.
Consider this invented monthly cost example. A system uses USD 900 in salt. Other measured variable costs are USD 300. It supplies 6,000 m3 that meets the agreed release checks. Listed variable cost is 1,200 ÷ 6,000 = USD 0.20 per usable m3.
If the same expense produces only 5,000 usable m3, the cost becomes USD 0.24 per usable m3. That is a 20% rise. This total excludes capital, fixed labour and downstream losses. Add them explicitly if they are part of the cost being compared.
Questions that often arise in the dyehouse
Does clear water need hardness testing?
Yes, when hardness is part of the process specification. Appearance does not measure dissolved calcium and magnesium. Use the required method at the defined sampling point.
Can conductivity confirm that a softener is working?
It can support investigation, but it does not replace a hardness result. Sodium exchange changes the dissolved-ion mixture. A conductivity reading cannot identify hardness on its own.
Should every dyehouse use one hardness limit?
No single limit is established here. The needed water quality depends on the process, products, equipment and treatment design. Agree the limit and the test capability before using the result for release.
Is a passing outlet result enough after a failure?
It confirms that sample at that time. Check the storage and distribution route, the corrective action and the affected production window. Previous tank contents or an open bypass can still matter.
Make hardness control a shared operating routine
The strongest routine links a suitable measurement to a named water route, a measured volume and a clear response. Keep the utilities and dyehouse records connected. When hardness changes, the team can trace the affected supply and its cause. It can assess the product using these facts. Final shade alone cannot explain the water event.
References
US Geological Survey — Hardness of Water.
US Geological Survey — Alkalinity and Water.
DuPont — AmberLite Ion Exchange Resins Water Conditioning Manual.
Hach — Total Sequential Hardness Method 8329.
Hach — Calmagite Hardness Method 8030 Reagent Set.
DuPont — Recommended Operating Conditions for Separate Ion Exchange Beds.



Discussion0
Loading the discussion…