

A textile laboratory may finish twenty quick tests while one order waits for its last result. The test counter looks healthy. The customer still cannot release the fabric. A useful turnaround dashboard must explain both facts.
Start with the service the customer bought. Was it one result, a set of tests, or an authorised report for several samples? Then measure the time from an agreed start to that service being ready. Keep unfinished work in view. A chart of completed tests alone cannot show what is stuck on the bench.
This guide develops a textile laboratory turnaround dashboard in Excel or Power BI. It covers receipt, acceptance, conditioning, parallel tests, outside laboratories and report release. All figures are hypothetical. The aim is to find delays that the team can remove. The work needed for valid results must remain.
Define the service before choosing a target
A turnaround promise needs a unit, a clock and a finish event. “Two days” is not enough. Two calendar days and two working days can lead to different due dates. A result entered by an analyst may still need review. A report may be approved but not yet sent to the customer.
Record these terms when work is accepted:
Term | Example definition | Why it matters |
Service unit | One agreed test package for one fabric sample | Stops a ten-test package becoming ten completed orders |
Start | Technical acceptance after the request is complete | Separates intake delay from the promised test clock |
Finish | Authorised report made available to the customer | Keeps draft results out of completed service |
Calendar | Monday to Friday, 09:00 to 17:00, listed holidays excluded | Makes working hours reproducible |
Scope | Named methods and required specimens | Stops extra work entering the original promise silently |
Exceptions | Agreed holds with reasons and approval | Prevents informal clock pauses |
For context, SDLABCOMO describes its turnaround terms. For its most requested tests, it states 24–48 working hours from acceptance where technically possible. It also says delivery dates are confirmed at acceptance. This is a qualified service statement from one laboratory. It is not an industry benchmark to apply to every method.
Keep the first accepted due date even if the customer later agrees to a new date. Show both dates and the reason for the change. Otherwise a late order can become “on time” simply because someone moved its target.
Use separate records for samples, tests and reports
A sample is the material received. A test item is a particular piece of work on that material. A report is an issued record of results. These objects often have different counts and dates.
Suppose request R104 contains two fabrics. Each needs three tests. The dashboard has one request, two sample records and six test items. If the customer wants one combined report, there is one report service to complete. Do not build a single flat table that repeats the request's completion flag six times and then sums it.
A practical structure has four linked tables. The request table holds the customer, service terms and due date. The sample table holds the receipt condition and sample identity. The test table holds method, laboratory, status and stage dates. The report table holds its scope, version, authorisation and release dates.
Add a small relationship table when a report covers several test items. It states exactly which results belong to that report. This matters when a preliminary report is issued while another test remains open.
Keep identifiers stable when descriptions change. “Navy fabric” is a useful label but a poor key. Two different lots can have the same description. Preserve the buyer's sample reference beside the laboratory's identifier. Use the laboratory identifier to join records.
The dashboard should also distinguish the original test from a repeat. A repeat needs its own attempt record linked to the same required test item. Closing two attempts must not count as delivering two customer services.
Choose clocks that answer different questions
Use three named measures: receipt-to-release time, acceptance-to-release time and active test time. They answer different questions. The first describes the customer's full wait after arrival. The second measures the accepted service. The third helps explain bench use.
Do not subtract one from another and call the remainder waste. Conditioning, required preparation and technical review may be necessary. The point is to name the stages so the team can investigate them.
Calculate calendar and working hours
Assume a sample arrives on Monday at 09:00. The laboratory accepts it at 11:00. The authorised report is released on Wednesday at 15:00. There are no holidays. The service calendar is 09:00–17:00 each weekday.
Calendar turnaround = release timestamp − receipt timestamp
The interval from Monday 09:00 to Wednesday 09:00 is 48 hours. Add six hours to reach 15:00. Receipt-to-release time is therefore 54 calendar hours.
Working hours use only the part of each open interval that overlaps the service interval:
Overlap = max(0, min(end, close) − max(start, open))
Here, start and end are the service timestamps. Open and close are the boundaries of one working interval. Convert each positive overlap to hours, then sum the intervals.
Day | Receipt-to-release overlap | Acceptance-to-release overlap |
Monday | 09:00–17:00 = 8 hours | 11:00–17:00 = 6 hours |
Tuesday | 09:00–17:00 = 8 hours | 09:00–17:00 = 8 hours |
Wednesday | 09:00–15:00 = 6 hours | 09:00–15:00 = 6 hours |
Total | 22 hours | 20 hours |
All three answers—54, 22 and 20—are correct for their stated definitions. They must not appear under the same label.
Excel's NETWORKDAYS.INTL function counts whole working days using a weekend pattern and optional holidays. It does not by itself calculate these partial-day hours. Three working dates multiplied by eight gives 24 hours. That overstates this example.
For hourly promises, use a calendar table with one row per open interval. If lunch is excluded by the service agreement, split the day around it. If the agreement counts the whole staffed day, keep it included. The method must follow the promise rather than the analyst's personal break record.
Store a calendar version with each accepted service. A later change to Saturday opening should not rewrite last month's reported performance. Some laboratories work across time zones. Preserve the original zone or offset. Calculate elapsed time on a consistent basis.
Keep the reporting cut-off explicit
An open order has no release time. Calculate its age at a stated cut-off, such as Wednesday at 16:00. Use that same cut-off for every open item in the report. Do not let one card use the current time while another uses yesterday's extract.
Show the cut-off near the oldest-work list. If the source stopped updating at noon, say so. Four hours of missing events could change which report is truly late.
Treat conditioning as part of the test route
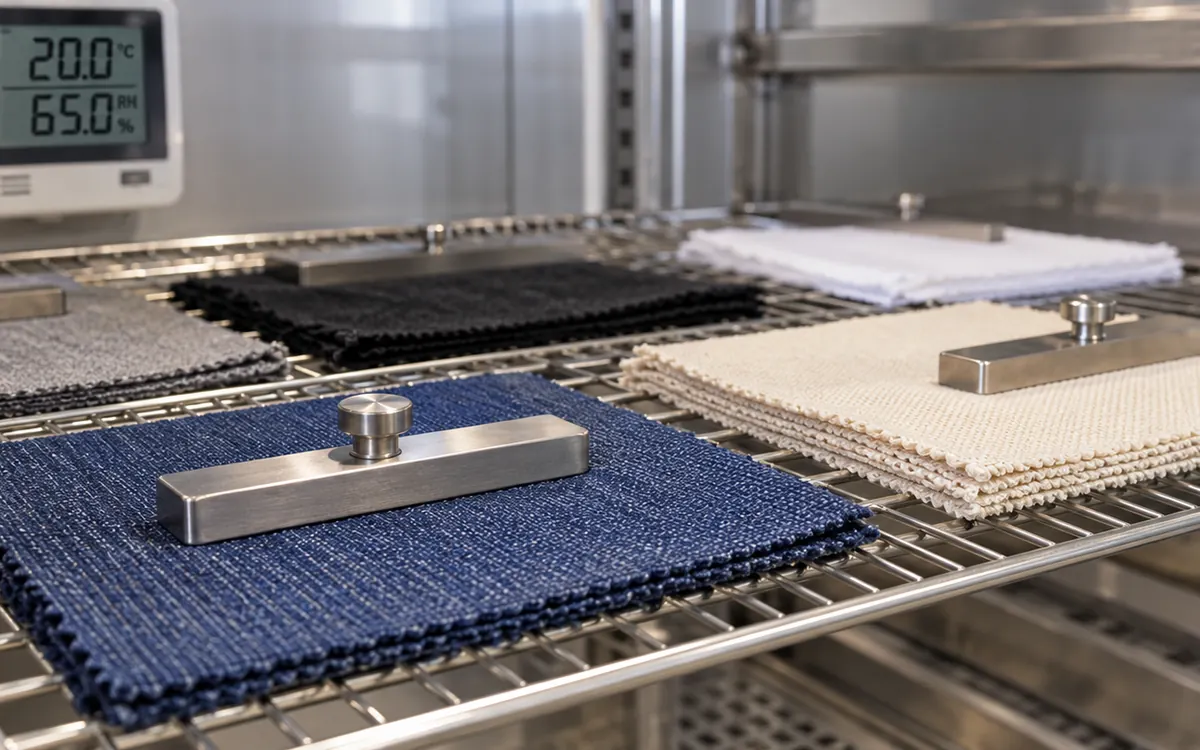
Textile testing cannot always start when a sample reaches the bench. ISO 139 concerns atmospheres for conditioning and for physical and mechanical textile tests. ASTM D1776/D1776M addresses conditioning when the test method calls for it, including preconditioning where required. Its public description relates conditioning to moisture equilibrium.
These sources do not set one fixed conditioning time for all fabrics and methods. Use the applicable method and the laboratory's approved procedure. A dashboard target must not shorten a required step to make a card turn green.
Track conditioning in stages. A sample may be waiting for space, in conditioning or ready for testing. It may need review after conditions leave the approved range. Record the time when the specimen is eligible to leave that stage. Do not assume that the timestamp of placing it in a room proves readiness.
This detail changes the improvement discussion. If ten samples wait for rack space, investigate space and loading. If samples are ready but remain uncollected, investigate handover. If a room condition is outside the approved range, the next step is technical review. Those three cases should not share a generic “lab delay” reason.
For a live board, show planned readiness beside actual readiness. Use the planned value to prepare the next bench, but use the approved actual event to release work. A forecast is not evidence that conditioning has been completed.
Separate legitimate holds from unexplained gaps
A customer may send too little fabric. The method may be unclear, or an outside result may need checking. Each problem can cause a hold. Record when it began, what blocks progress, who can resolve it and when it ended. Keep free text for context, with a small stable list of reason codes for analysis.
Do not remove every hold from the customer clock. Some service agreements permit exclusions; others do not. Always retain the unadjusted elapsed time. Add an adjusted measure only when its rule is clear.
Suppose an accepted service spans 20 working hours. An approved missing-information hold covers Tuesday 10:00–13:00. A second hold for the same service covers 12:00–14:00. Their durations are three and two hours. Their combined coverage is four hours, because noon to 13:00 overlaps.
Adjusted service time = 20 − 4 = 16 working hours
Subtracting five hours would report 15 hours and remove the overlap twice. Merge overlapping hold intervals before subtracting them. Clip holds to the service interval and to working time as well. A hold that starts before acceptance cannot remove time that was never in the clock.
Use “reason not yet recorded” as an honest category. Do not let the dashboard allocate all unexplained time to the customer. Ask the owner to resolve the record while the details are still available.
Find the test that controls the report date
Several tests may run in parallel. Their total bench hours measure workload, but their sum is not the report's elapsed time.
Consider one package with three independent tests. From acceptance, the approved results become ready after 6, 14 and 22 working hours. The report then needs three working hours for compilation, review and release. Assume that final stage starts when all results are ready.
Package turnaround = max(6, 14, 22) + 3 = 25 working hours
The mean test time is 14 hours. The sum is 42 hours. Neither gives the 25-hour customer turnaround. The longest route controls this simple example.
If the third test can start only after a preparation step, include that dependency. One instrument may process several samples together. Separate each sample's wait for a run from its time in the run. A common start timestamp for every item can conceal a long queue before loading.
Show a compact route for each late package. Include required tests, readiness, dependencies and remaining report work. Let a user open the blocking test from the order row. The manager can then ask precise questions. Is the external result still missing? Has it arrived but not yet been reviewed?
For outside tests, record dispatch and receipt by the other laboratory. Keep the agreed return date. Then record result receipt and internal review. A courier receipt is not a result. An attached report is not proof that its sample identity and scope have been checked.
Keep subcontracted work visible in the service total. NATA's reporting guidance says subcontracted results should be identified. The dashboard should retain that link so staff can trace a delayed report to the relevant outside service.
Show distributions with their sample counts
A mean can hide a long tail. Use the median and a higher percentile for completed services. Select a meaningful test group with the same clock. Show
the number of services beside both measures.
For a small illustrative set, completed turnaround times are 8, 10, 12, 14 and 30 working hours. Their sum is 74 hours and their mean is 14.8 hours. The median is 12 hours. The longest case is 30 hours.
Excel's PERCENTILE.INC accepts a percentile from zero to one and interpolates when needed. For the 90th percentile in this five-value set, use the inclusive position:
Position = 1 + (n − 1) × p
Here n is five services and p is 0.90. The position is 1 + 4 × 0.90 = 4.6. It falls 60% of the way between the fourth and fifth sorted values.
P90 = 14 + 0.6 × (30 − 14) = 23.6 hours
In Excel, enter the five values in B2:B6 and use =PERCENTILE.INC(B2:B6,0.9). This describes the observed set under that calculation method. Five cases do not establish a reliable promise for future demand. Keep that limitation visible when a small group is selected.
Do not average departmental percentiles to obtain a laboratory percentile. Recalculate from the underlying eligible service records. A three-report group should not have the same weight as a three-hundred-report group by accident. If equal weighting serves a purpose, name that comparison clearly.
Put overdue open work beside completed performance
Completed reports are useful for learning, but open work drives today's decisions. Build a view of services due within the selected period. Include every active service, whether released or still open.
Suppose ten packages are due by Friday's cut-off. Seven were released on time, one was released late and two remain open past due. On-time delivery is seven divided by ten, or 70%. Looking only at the eight released packages gives 87.5%. That second rate answers a narrower question and hides the two customers still waiting.
Give each overdue open package a row. Show its due date, age and overdue working hours. Add the blocking stage and next action. Sort by risk or commitment, not only by age. A young test may be tied to an imminent shipment. It may need attention before an older research sample with no urgent deadline.
If a package was cancelled, retain its cancellation date and reason. Decide how the agreed service measure treats cancellations before using the chart. Removing cancelled rows after seeing the result makes the trend hard to trust.
A preliminary report also needs separate treatment. NATA allows preliminary reporting before all work is complete when the reported parts have been checked and authorised and the report is identified as preliminary. A laboratory can measure that useful early service without closing the final package clock.
Build a board that leads to a bench decision
A short morning meeting gives the page a purpose. Imagine that request R105 is due at 15:00 today. Two test items have passed review. The third result arrived from an outside laboratory at 08:30, but nobody has checked its sample reference. A board that says “all results received” may look reassuring. The report is still not ready to issue.
The useful row says what remains: check the external sample reference, review that result, then authorise the combined report. Give each action to someone who can perform it. Agree a check time early enough to contact the customer if release is at risk. The dashboard should make this sequence visible without implying that the result will pass.
Arrange the first page around that discussion. Show services due and overdue at the cut-off. Follow with open work by the stage blocking release. Put completed turnaround by comparable method group below it. Keep a short list of packages needing action today.
Include sample ID, customer promise, remaining work, owner and next check time in that list. After the meeting, record the action in the source workflow. Do not leave it only in a slide or a manager's notebook. Avoid displaying confidential results when a status will meet the audience's need. Detailed result access belongs to the laboratory's controlled systems.
Use counts and hours together. Twelve tests awaiting review may be routine if each takes a few minutes. Two complex reports may require more work. Add an estimated review effort only if staff can maintain it reliably. Label it as an estimate rather than disguising it as measured labour time.
Do not rank analysts by raw turnaround without context. Different methods, specimen conditions and review duties create different work. Use the board to locate queues and handover failures. Then review a small set of cases with the people who did the work.
The ApparelDiary guide to reading a washing colourfastness report explains why the report's test context matters. A turnaround chart should point to that evidence, not reduce a technical result to a delivery tick.
Read the review queue in hours as well as reports
Consider a morning queue with eight routine reports and two investigation reports. The team estimates 15 minutes for each routine review. Each investigation needs an estimated 90 minutes. These are planning estimates for this example, not standard times.
Estimated review load = (8 × 15) + (2 × 90) = 300 minutes
The queue therefore represents five hours of review. Ten reports divided by two reviewers does not prove that each reviewer has the same load. One person may be authorised for the routine methods. The other may have to handle both investigations. Show the required review competence beside the work before allocating it.
Now suppose a reviewer has four hours available after other duties. The estimated queue exceeds that person's available time by one hour. Ask which reports can move to another authorised reviewer. Check which due dates are at risk. Find out whether missing information will add work. A count alone cannot answer those questions.
At the end of the day, compare estimates with actual review effort on a small sample. Improve the estimates if they are useful. Drop them if recording effort costs more than the planning decision gains. Never treat an estimate as a reason to skip a necessary check.
Validate the dashboard with awkward cases
Before release, choose a few real examples that staff are allowed to use. Match the chart to their records. Use test copies for deliberate edge cases. Check the following behaviours with the laboratory team:
For a sample received before opening, the working clock starts at opening. Calendar time starts at receipt.
A same-day service uses its actual hours. It does not become one full working day by default.
Two overlapping holds remove their union only once when adjustment is allowed.
A package with one open required test remains open after the other tests finish.
A preliminary report does not close the final report service.
A repeat test adds an attempt without adding a second delivered package.
A late outside result remains part of the customer's total wait.
A change in the service calendar leaves past accepted clocks reproducible.
Check joins as carefully as formulas. If one report has six test items and two attachments, a careless join can create twelve rows. Count distinct services at the right grain. Reconcile both record counts and total times after adding a new table.
Keep a short calculation note beside each measure. It should state its unit, start, finish, exclusions and date filter. This is more useful than a long technical manual that nobody consults during a delivery meeting.
Questions laboratory teams often ask
Should turnaround stop when the analyst saves the result?
Only if that is the defined service being measured. For a customer report promise, include the required review and release steps. Keep analyst completion as a separate event. A queue after testing will then remain visible.
Can all methods share one target?
They can share a reporting layout, but a single time target may be unsuitable. Group work by method route, service terms and relevant preparation. Show an overall service measure alongside these groups, with a clear explanation of its changing mix.
Should conditioning time be excluded?
Follow the accepted service terms and applicable test procedure. Retain the full customer wait in all cases. A separate conditioning stage helps explain the time spent there. It does not make that time an automatic exclusion.
What if the source only stores the current status?
Start recording stage events before claiming stage durations. Current status can support an open-work list. It cannot reveal when every past stage began or ended. Mark historical stage times as unavailable instead of estimating them from row update dates.
Conclusion
A useful laboratory turnaround dashboard follows the full service. It starts at receipt and ends when an authorised result reaches the customer. It also shows the work that has not finished. Clear clocks, test dependencies and report scope make the numbers explainable. The team can then reduce avoidable waiting. Conditioning, review and other essential steps retain their place in a valid textile test.
Turnaround dashboards combine queue theory and dashboard design, so see factory KPI dashboard design, queuing theory, EDD versus SPT dispatch rules and the manufacturing analytics stack.
References
SDLABCOMO: textile laboratory services and turnaround terms.
ISO 139: standard atmospheres for conditioning and testing, public overview.
ASTM D1776/D1776M: conditioning and testing textiles, public abstract and scope.
Microsoft: NETWORKDAYS.INTL function.




Discussion0
Loading the discussion…