
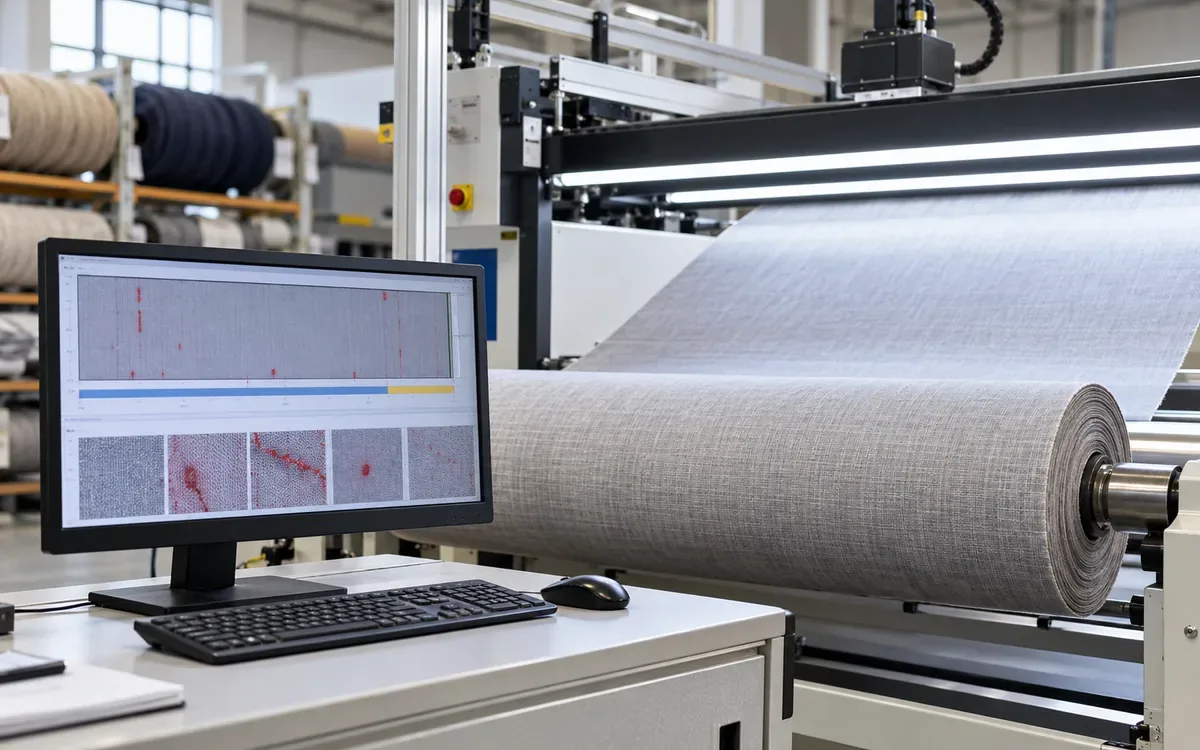
A roll can have a low overall defect count and still be awkward to cut because several faults sit close together near one end. A long defect may run beside a usable strip. A summary grade cannot show where these problems are.
A fabric inspection dashboard with a roll defect map answers a more practical question: where is the affected fabric, and what should happen to it next? To answer well, the map needs more than coloured dots. It needs a known origin, measured coordinates, defect extent, inspection coverage and a link to the physical roll.
This guide explains how to design that dashboard in Power BI or a similar reporting tool. It includes worked examples for reversed rolls, overlapping defect zones and inspection coverage. All example measurements are hypothetical. Apply the buyer's agreed inspection and cutting rules to actual fabric.
Decide what the map must help people do
Begin with a specific use. An inspector may need to review a doubtful detection. A warehouse team may need to locate a marked area. A cutting planner may need to assess whether defects can be kept away from important panels. Those users share coordinate measurements, but their responsibilities and decisions differ.
Separate three layers, starting with an observation layer that records what was seen. The review layer records whether a detection is accepted, rejected or still uncertain. The disposition layer records the approved action for the fabric. A suspected mark should not become a compulsory cut simply because it appears on the map.
Commercial systems show why this distinction matters. Serkon describes live X and Y defect positions and roll-level reporting. Datatex CATS connects roll mapping with grading and cut planning under customer rules. Shelton's WebSpector describes a sequence from inspection through map review to cut planning and execution.
These vendor descriptions explain available functions, but they do not establish a detection rate or a yield saving for your fabric. The dashboard design below uses the underlying data concepts. Its calculations do not depend on any claimed vendor performance.
Define the coordinate system before drawing a dot
Choose a documented convention. For this article, x is distance along the roll in metres, starting at zero at the inspection leading end. The y coordinate is distance across the width in metres, starting at the left edge when viewed from the stated inspection face.
Other systems may use different coordinate conventions, so do not infer them from the letters X and Y. Confirm the export definition with the system owner and retain it with the data.
Record at least these facts for an inspection run:
Field | Meaning | Example |
Roll ID | Physical roll being inspected | R5201 |
Run ID | One inspection pass | I5201-02 |
Leading end | End that entered the machine first | Supplier end A |
Viewed face | Face seen by inspector or camera | Face side |
Width origin | Edge used for y = 0 | Left edge in inspection view |
Length basis | Source of distance along the fabric | Verified encoder record |
Units | Units used for each coordinate | Metres for x and y |
Coordinate version | Definition used by the export | Map convention 1 |
Keep the roll's physical label readable after inspection, since a good map is useless if two rolls have swapped labels. At a handover, scan or check the roll ID before opening the map. Show that ID prominently on the screen and any printed record.
A position is also incomplete without its measurement basis. The supplier's ticket may show 100 m while the inspection run measures 99.4 m. Preserve both values under clear names. Use the approved measured basis for the map, and investigate the difference through the receiving process.
The ApparelDiary fabric roll acceptance checklist covers that receiving decision. The map should add location evidence to the accepted roll record, not replace the receiving checks.
Store defect extent as well as position
A small spot can be located by a point, but a streak needs a length. An irregular patch may need a bounding box and a photo. Do not treat every detection as the same geometry.
Use a defect event record with a unique ID, roll ID, run ID, type and review status. Add start and end coordinates where the source provides them, and keep original values beside any converted coordinates. A correction to the display convention should not erase the original measurement.
Geometry | Useful data | Display treatment |
Point | x and y, plus location uncertainty if known | Marker with exact coordinate in the detail view |
Lengthwise fault | x start, x end and width position | Segment or narrow rectangle |
Widthwise fault | x position and y extent | Segment across the stated width |
Patch | x and y bounds, linked image | Bounding box identified as an approximation |
Unlocated observation | Description and reason location is absent | Separate list, not a point at zero |
Keep defect size, grade points and proposed cut allowance in separate fields. A five-centimetre mark may lead to a wider exclusion zone under a particular plan. That does not make the observed mark wider. Likewise, a four-point score is a grading value, not an area measurement.
Retain the review trail when a camera detection is dismissed. If two detections are merged into one physical defect, record the surviving event and its source links. Do not simply remove the second row and lose the basis for the decision.
Transform coordinates when the roll direction changes
An inspection map may be correct at the inspection machine yet confusing at the cutting table because rewinding may change which end arrives first. Turning the fabric can also change the visible edge convention. Treat these as separate transformations.
Assume a measured roll length L of 100 m. A point lies at x = 12 m from the original leading end. If the new view starts from the opposite end:
New length position = L − original length position
New length position = 100 − 12 = 88 m
For an interval from 12 to 13 m, transform both ends and sort them. The new interval is 87 to 88 m. It is still one metre long. Simply changing the start to 88 and adding one would place it at 88 to 89 m, which is wrong.
Now assume a constant width W of 1.50 m. A point is 0.20 m from the original left edge. If the new view also reverses the width origin:
New width position = W − original width position
New width position = 1.50 − 0.20 = 1.30 m
An original width interval of 0.20 to 0.30 m becomes 1.20 to 1.30 m. Reversing the feed direction does not automatically require this width reversal. Determine what happened to the physical roll and viewing face before applying it.
Show the active view in the map title: original inspection view or current feeding view. Keep a visible arrow or text label for the leading end in the software. A user should not need to remember a hidden filter to interpret the coordinates.
These transformations assume unchanged dimensions and a known total length and width. Finishing, stretching, trimming or cutting can break that assumption. If dimensions changed, use a validated mapping for that process or re-inspect. Do not scale every old position by one ratio without checking whether the change was uniform.
Measure inspection coverage separately from roll length
The roll may be 100 m long, but only 75 m may have been inspected. A map with no marks on the final 25 m must not imply that this section is clear.
Record inspected intervals and give uninspected sections a distinct label or shading in the software. Keep the reason: incomplete pass, camera outage, inaccessible width or a sample inspection plan. The operator should be able to distinguish “no reviewed defect found” from “no evidence collected.”
In a hypothetical 75 m inspection, staff confirm 15 defect events. The rate per 100 inspected metres is:
Defect event rate = confirmed events / inspected metres × 100
Defect event rate = 15 / 75 × 100 = 20 events per 100 m
Using the full 100 m roll length would give 15 events per 100 m. That would understate the observed rate for the inspected portion. Neither figure proves the uninspected section has the same quality.
Reinspection introduces another trap. Suppose one pass covers 0–60 m and another covers 40–80 m. The machine has inspected 100 pass-metres in total. Unique physical coverage is only 80 m, because 20 m was inspected twice.
Unique covered length = 60 + 40 − 20 = 80 m
For a 100 m roll, coverage is 80%. Keep pass-metres for machine workload and unique covered metres for coverage, with a defined review version supplying defects in the overlap. Counting both lists may count the same physical fault twice.
Merge overlapping exclusion zones before calculating loss
A cutting decision may exclude full-width bands around selected defects. The dashboard should calculate the union of those bands, not add their lengths blindly.
Assume three approved exclusion intervals on a 100 m roll:
Zone | Start | End | Individual length |
A | 10.0 m | 10.6 m | 0.6 m |
B | 10.4 m | 11.0 m | 0.6 m |
C | 30.0 m | 30.2 m | 0.2 m |
The individual lengths add to 1.4 m. Zones A and B overlap by 0.2 m. Together, they cover 10.0–11.0 m, or 1.0 m. Zone C adds 0.2 m.
Excluded length = 1.0 + 0.2 = 1.2 m
Length outside exclusion zones = 100 − 1.2 = 98.8 m
The 98.8 m is a geometric remainder that does not yet establish saleable or cuttable yield. Minimum piece length, end trims, splice rules and the planned marker can reduce what is useful.
If the approved plan adds 0.1 m clearance at both ends of each zone, expand the intervals first. A becomes 9.9–10.7 m, B becomes 10.3–11.1 m and C becomes 29.9–30.3 m. Merge again. The first two now cover 1.2 m; the third covers 0.4 m. Total exclusion is 1.6 m, leaving 98.4 m outside the zones.
This example assumes full-width removal and fixed clearances. A plan that avoids a small patch within a marker needs two-dimensional geometry. Do not use the full-width formula for that different decision.
Keep area estimates honest
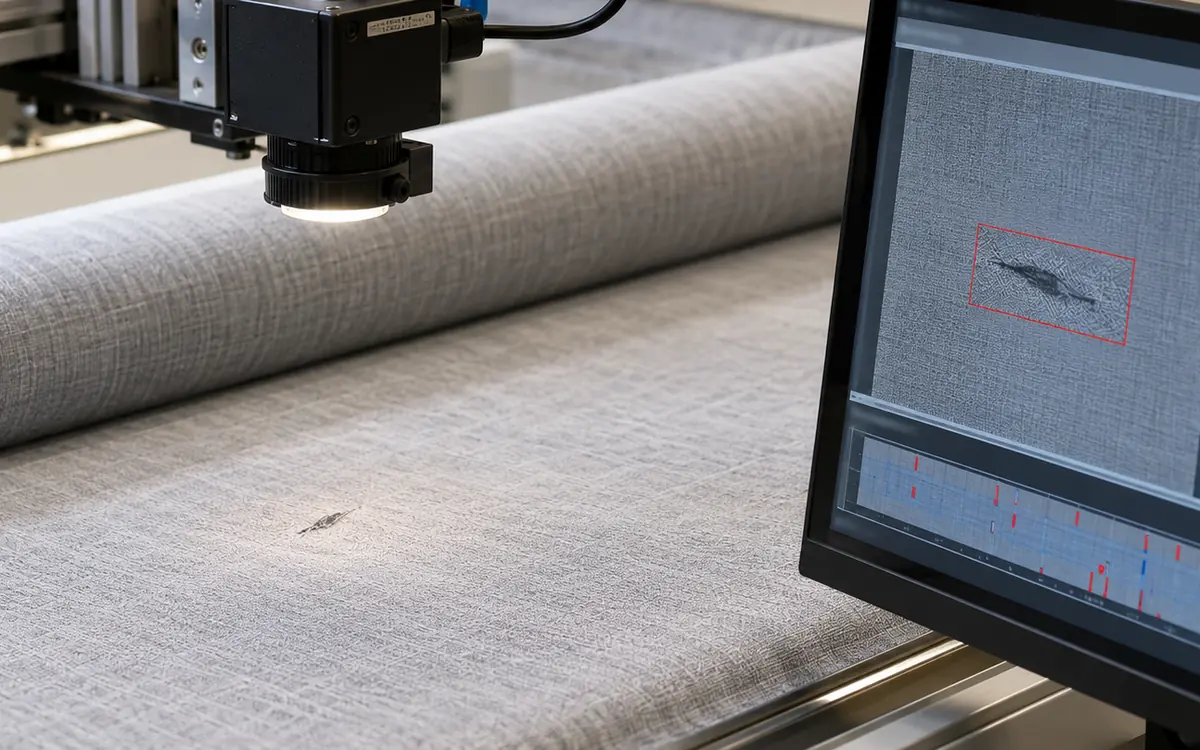
A rectangular bounding box is a simple way to represent a patch. It may include sound fabric around an irregular fault. Label the resulting area as box coverage rather than measured defect area unless the source actually measures the shape.
For example, box A covers 1.0 m by 0.2 m, giving 0.20 square metres. Box B covers 0.5 m by 0.3 m, giving 0.15 square metres. Assume their overlap is 0.5 m by 0.1 m, or 0.05 square metres.
Combined box coverage = 0.20 + 0.15 − 0.05 = 0.30 m²
Adding the boxes without removing the overlap would give 0.35 square metres. That is another form of double counting. For many irregular regions, use a tested geometry method and keep a simple set of known examples for verification.
Nominal width is not automatically the width available to the cutter. Link the map to the approved usable-width record. The ApparelDiary guide to usable and nominal width explains that distinction. A defect outside a particular cutting zone may still matter to the roll's agreed grade or another customer's use.
Build a Power BI map without losing individual events
Begin with three small tables for rolls, inspection runs and defect events, linked through stable identifiers. Keep a separate interval table for coverage and another for approved exclusion zones if those decisions can change.
On a roll-detail page, filter to one roll and one chosen inspection or reviewed map version. Display the measured length, width basis, inspected coverage and coordinate convention above the visual. A lot summary belongs on another page; overlaying ten rolls on one coordinate plane can make unrelated marks appear to form a pattern.
Microsoft's scatter-chart guidance supports plotting numeric X and Y values. It also explains that a unique field in the Values area can keep individual points from collapsing into an aggregate. For a defect map, use the defect event ID as that unique field. Two distinct observations may share coordinate values, so a key built only from x and y is insufficient.
Use x for length and y for width under the convention already defined. Add defect type or review status as a visible distinction. Keep exact coordinates, event ID and the linked evidence in a detail table. A large marker can help someone select a small defect, but its screen diameter must not imply the defect's physical size.
The current Microsoft documentation states a 10,000-point maximum for scatter charts. Check the plotted count against the eligible event count. For dense rolls, use a selected length window or a reviewed summary with a complete detail list. Never let a display limit quietly become an inspection record limit.
Use a rectangle-capable visual or dedicated mapping tool for extents. A point chart is suitable for locations; it cannot by itself communicate every shape or cut boundary. If the axes are stretched to fit the screen, label the view as schematic. Do not infer physical angles or areas from that display.
Connect summary trends to the exact roll
The summary page can show confirmed events by defect type, machine, fabric family and production stage, with the denominator beside each rate. A machine processing wider or longer rolls may create more observed events simply because more fabric was inspected.
Use Power BI drillthrough to move from a selected roll to its detail page. Add the roll ID to the target page's drillthrough fields and use that field in the source visual. Microsoft describes how the selected context filters the detail page. Verify that the page also selects the intended map version.
Do not mix every source of a “defect” into one total. Uster describes Q-Bar as on-loom formation monitoring. That process signal is different from a confirmed mark on a finished roll. A detected formation problem may prompt action before a long fabric fault develops.
Keep source stage and event type in the model, linking related events when evidence supports the relationship. Do not assume that one loom alarm equals one finished-fabric defect, or that every finished defect has a matching alarm. The dashboard should help investigate that link rather than invent it.
Preserve maps when rolls are split or joined
Physical changes need new records. Suppose a parent roll is cut at 40 m. The first child contains parent coordinates 0–40 m. The second contains 40–100 m. A defect at parent x = 52 m belongs to the second child at x = 12 m, assuming the same feeding direction.
Child position = parent position − child start
Child position = 52 − 40 = 12 m
Retain the parent-to-child range without overwriting the parent map with the child's coordinates. If the child is also reversed, apply the reversal after translating to the child's length basis.
When pieces are joined, store the segment order and source range for each piece. A seam or join may create a new event that belongs to the assembled roll. Keep it separate from defects inherited from the source pieces.
This lineage lets staff explain a claim against a child roll without searching every original inspection file. It also prevents a defect removed during trimming from appearing on the remaining piece. The removal decision and physical cut must agree before the inherited map is updated.
Test the map against the fabric
Use a controlled trial roll or approved reference marks. Include positions near both ends and both edges, plus an interval and two overlapping areas. Compare the software view with measured locations under the intended operating conditions.
Check more than coordinate arithmetic. Does distance drift as the roll advances? Does a stop and restart shift the origin? Does rewinding reverse the map correctly? Does changing the viewed face also change the width convention? Record the observed location error and agree an acceptable tolerance for the use.
Use the tolerance to guide decisions. A map adequate for finding a region by hand may be inadequate for an automatic cut boundary. Do not transfer the same acceptance tolerance to both uses without a technical review.
Test missing data as well. Remove a width value, omit an inspection interval and import a repeated event ID. Each case should produce an explicit exception. It should not create a dot at the origin, claim full coverage or double the event count.
A short handover exercise can expose a fault that a chart review misses. Use the earlier 100 m roll with the mark at 12 m. The inspector hands over the roll after rewinding, and the cutting operator opens its original map. The screen shows the right roll ID and a clear dot. Yet the operator searches 12 m from the new leading end and finds nothing.
Stop the exercise at that point. Do not let the operator mark the event as “not found” and release the fabric. Compare the end labels, the viewed face and the selected map version. If the feeding direction has reversed and the length is unchanged, the same point is 88 m from the new start. Confirm that location on the fabric.
The trial has tested two things: coordinate conversion and the handover itself. A correct conversion hidden in a menu would still leave the next operator at risk of using the wrong view. Put the active leading end beside the roll ID, then repeat the exercise with a second person who did not set up the map.
Distinguish a shifted origin from distance drift
Two kinds of error can look similar near the start of a roll, so use separated reference marks to examine the pattern. Keep the physical reference measurement independent of the device being checked.
In one hypothetical trial, marks at 10.0 and 80.0 m appear at 10.5 and 80.5 m. Both errors are +0.5 m. That pattern suggests an origin offset. In a second trial, the same marks appear at 10.15 and 81.20 m. The errors grow from +0.15 to +1.20 m.
Relative position error = (reported − reference) / reference × 100
For the second trial, 0.15 / 10 × 100 is 1.5%. At the later mark, 1.20 / 80 × 100 is also 1.5%. That pattern suggests a scale problem under the trial conditions. It does not prove the cause. Slippage, tension and the reference method still need investigation.
A fixed half-metre adjustment would not solve the second example. Likewise, changing a scale factor would be the wrong first response to a simple origin reset. Keep the trial readings and the machine conditions so a technician can examine the evidence.
After a correction, repeat the physical check across the working range. Mark which inspection runs used the earlier setting. Review whether their locations remain fit for the intended use. Do not silently redraw old maps with a new correction unless the basis is justified and the changed version is recorded.
Common questions
Can a roll map replace a grading system?
No. The map describes location and extent. The agreed grading method describes how observations affect acceptance. Store both, with the rule version used. A change in grading policy should not alter the original defect location.
Is a blank area on the map defect-free?
Only the recorded inspection scope and detection process can support that interpretation. Show uninspected or uncertain areas clearly. Even inspected areas should be described in terms of what the process found, not as a guarantee of perfection.
Should rejected camera detections disappear?
They can be hidden from the default confirmed-defect view. Keep their source record, review decision and reason. This allows later review of false detections and prevents a chart filter from becoming deletion of evidence.
Can the map calculate cutting yield?
It can support a defined calculation. Full-width exclusions, marker avoidance and finished-piece allocation are different problems. State the assumptions and retain the approved plan. A geometric remainder is not the same as achieved production yield.
Conclusion
A useful roll defect map keeps location, evidence and action connected. Define the origin and units, retain defect extent, show coverage and preserve the links when fabric is moved or cut. Then test the display against the physical roll. Those steps turn an inspection dashboard into a practical handover tool that staff can use with confidence.
Inspection dashboards support receiving decisions, so see the fabric roll acceptance checklist, factory KPI dashboard design, Pareto charts for defects and shade segregation.
References
Serkon: live defect mapping and reporting.
Datatex: CATS fabric inspection and cut planning.
Shelton Vision: WebSpector workflow.
Uster: Q-Bar formation monitoring.



Discussion0
Loading the discussion…