
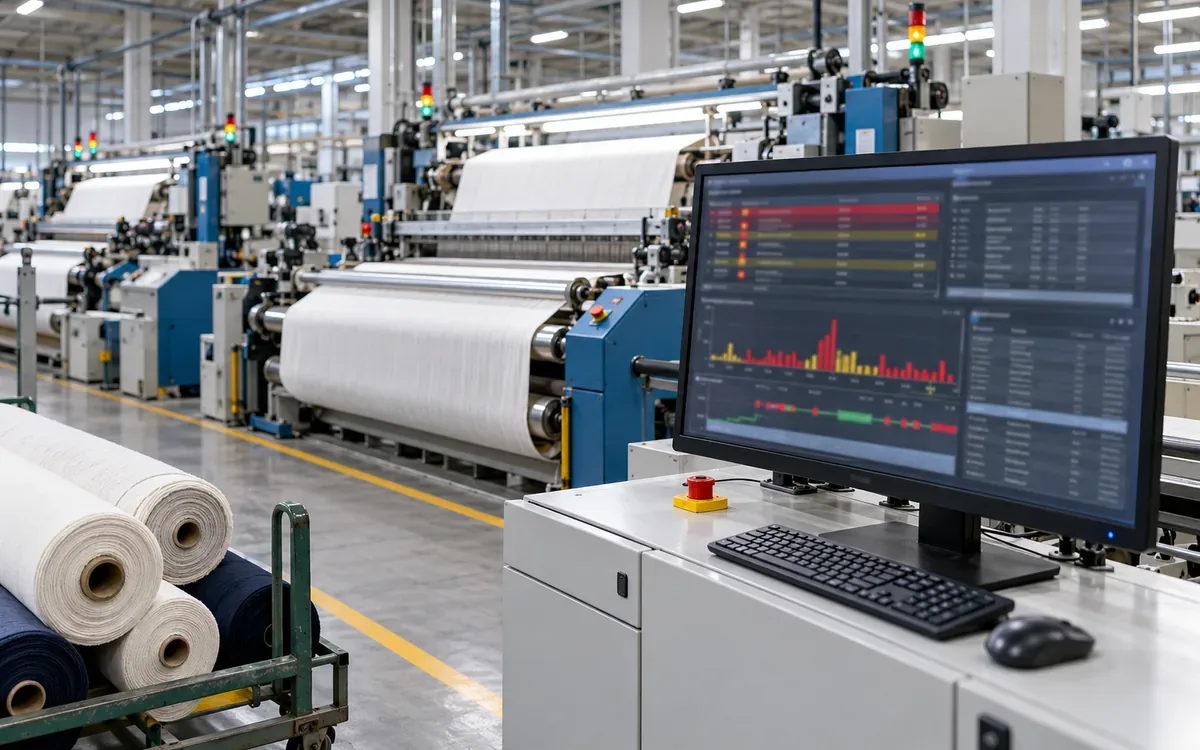
A textile line can generate dozens of alarm records during one brief stop. Another machine can keep running while a warning stays active for hours. A dashboard may add every alarm duration and call the result downtime. That will mislead both production and maintenance.
A textile machine alarm dashboard should answer three separate questions. What alarm load reaches the operator? Which conditions remain unresolved? Which alarms are linked to confirmed production stops? Those questions need related data, but they do not share one numerator.
This guide develops a practical reporting design for mixed textile equipment. It covers alarm cycles, floods, standing conditions, timing and stop links. All numerical cases are hypothetical. The aim is to make the evidence clear enough for an engineer to inspect and an operations team to use.
Begin with the decision the dashboard must support
An alarm review may aim to reduce repeated warnings. It may study a stopped machine or improve response to a serious condition. Name the purpose before choosing charts.
A daily engineering review needs recurring sources and unresolved cases. A shift supervisor needs the current state and the owner of an open response. A reliability review needs verified failures and lost operating time. Sending all three users one ranked alarm count can hide the distinctions that matter.
The ISA alarm-management series places monitoring within a wider lifecycle. Its public overview includes alarm rates, standing alarms and response times. It also treats batch, discrete and packaged equipment as contexts with defined needs. A dashboard is one part of that work; it does not establish an alarm philosophy by itself.
For a textile pilot, choose a defined equipment group and review period. For example, start with one finishing-line operator. Review the alarms shown to that person during staffed shifts. Document which machine panels and central displays belong to that responsibility.
Keep a separate machine-focused view for fault review. One person may monitor ten machines. Combining their alarms can then help check that person's workload. It may make no sense for comparing the reliability of a single motor.
Separate recognition, clearance and return to work
Acknowledging an alarm does not mean that its condition has cleared. The OPC Foundation's alarm terminology treats recognition and active state as separate facts. It also defines latching alarms. These can remain in alarm until reset, even after the process returns to normal.
In Ignition's documented model, active status and acknowledgement combine into four states:
Condition state | Acknowledgement state | Reporting meaning |
Active | Unacknowledged | The alarm remains active and has not been acknowledged |
Active | Acknowledged | Recognition is recorded; the alarm remains active |
Cleared | Unacknowledged | The alarm cleared before acknowledgement was recorded |
Cleared | Acknowledged | Both transitions have occurred |
These are software states. The dashboard still needs to know what the machine vendor means by active, clear and reset.
The record often calls acknowledgement “ack.” This guide uses that short form below where it helps. Acknowledge time can support a response measure. Clear time can support an alarm-state duration. Actual machine recovery must come from a defined production-state signal or verified event. Do not use one of these timestamps as a substitute for another.
Suppose an alarm starts at 08:00, is acknowledged at 08:02 and clears at 08:12. Recognition delay is two minutes. Active duration is twelve minutes. Neither number proves that the machine stopped for that long.
If another alarm clears at 08:03 but is acknowledged at 08:04, keep both facts. A dashboard that requires ack before clearance may reject a valid sequence.
Build the event model before the visual layer
Keep raw transitions as well as a prepared table with one row per alarm occurrence. The raw data allow review; the cycle table makes normal reporting manageable.
Useful raw fields include source system, machine and source path. Keep the transition ID and occurrence ID where available. Add event type, event time, time received and quality status. Include the original priority and message. Keep process step, recipe or production lot when the source can supply them reliably.
The prepared row stores one alarm cycle. It can contain first active time, acknowledged time and clear time. Add the current state and flags for missing data. Do not silently create a clear time when none was received.
For example, the Ignition Alarm Journal schema gives each journal row an id. A separate eventid links the active, clear and ack cycle. It also stores event type and flags. That distinction prevents counting three transitions as three new alarms.
The same field name can mean something else in another protocol. The OPC UA event-sequence example shows several EventId values from one Condition instance. The IDs change with each transition in that example. An Ignition grouping rule thus cannot be copied directly onto OPC UA EventId.
Create a mapping for each source. State which key identifies a transition. State which key identifies an alarm definition. Explain how the system builds each occurrence. Verify it against a controlled sequence from that system.
Use a stable machine identity. A friendly message such as “Drive fault” is not unique across a mill. Keep the source code and display a helpful name beside it. If an asset is renamed, keep the historical mapping.
Count new activations without losing repeated faults
Consider ten complete alarm cycles. Each produces one active, one ack and one clear record. The journal contains thirty rows, but the activation count is ten.
Now suppose a data transfer repeats three of those rows. The landing table contains thirty-three rows. Removing exact duplicate transition identities restores thirty distinct transitions. Building the cycles still gives ten activations.
Do not remove every repeated message within a minute. A sensor may genuinely clear and activate several times. That pattern is part of the engineering problem. A broad rule that removes repeated text could erase it.
Use a source identity or another validated transition key to remove duplicate transfer rows. Keep a record of what was removed. If the source lacks enough identity to distinguish a retry from a new event, flag the ambiguity.
An activation metric also needs an inclusion rule. It may count all source activations. It may count only alarms shown to users, or only one alarm class. Choose the rule clearly. Those are different groups. A filtered dashboard should display the rule next to the number.
A production message differs from a maintenance reminder. A high-priority process alarm differs again. Do not place them in one workload group by default. Keep the original type before mapping it to the site's reporting groups.
Measure alarm load over the relevant time exposure
A count needs a time basis. State which time belongs in the denominator. It might be all monitored time or only staffed time. Define any other basis.
Assume one operator position receives 240 new alarms. The valid monitored period lasts 480 minutes:
Mean rate = 240 / 480 = 0.5 alarms per minute
There are sixty minutes in an hour, so the same rate is thirty alarms per hour. This is an average over the full eight-hour period. It does not reveal whether arrivals were evenly spread.
Suppose forty arrived in one ten-minute interval. That interval's rate was four per minute. The shift average hides the burst.
When comparing shifts, keep both the count and valid monitored time. A four-hour data outage should not enter as four hours with zero alarms. Display the missing period and qualify the comparison.
Also separate operator exposure from machine exposure. If two operators share a panel for part of the shift, the assignment history matters. Dividing by machine count does not tell you the workload each person faced.
There is no universal textile threshold established by this example. Choose the monitoring rules through the site's alarm-management process. A dashboard should report the approved rule and its version. A chart's colour scale should not invent a limit.
Detect bursts with explicit window rules
The OPC Foundation describes an alarm flood in terms of workload. Alarms arrive faster than the operator can manage them. Its terminology page does not prescribe one numerical trigger. The report thus needs an explicit local rule. State which alarms the rule includes.
For a teaching example, suppose the site uses ten-minute windows. It flags a window if more than ten new alarms were shown. This is an illustrative rule, not a compliance claim.
Two common calculations answer different questions. Fixed windows divide the shift into separate intervals. Rolling windows look back from successive points in time. A burst across a fixed boundary can look small in each fixed bin but large in a rolling view.
Assume six alarms arrive at 09:08 and six at 09:11. The fixed windows 09:00–09:10 and 09:10–09:20 each contain six. A ten-minute window ending at 09:12 contains all twelve.
Define the boundary convention. One useful convention includes the start and excludes the end of a fixed interval. Then an event exactly at 09:10 belongs only to the second bin. Whatever rule is chosen, use it consistently.
Rolling windows overlap. Do not sum their counts to obtain a total number of alarms. The same activation may appear in many successive windows.
Nor should a dashboard sum overlapping highlighted windows to claim flood duration. If flagged windows cover 09:00–09:10 and 09:05–09:15, their combined coverage is fifteen minutes, not twenty. Call this the union of flagged windows. It is not automatically the duration of the underlying process upset.
For an operational flood-duration metric, define the entry and exit logic separately. Record when the system enters the flood state, when it exits and how gaps are handled. Then test that logic on a known event sequence.
Keep alarm duration distinct from stopped time
Two simultaneous conditions can create more alarm-minutes than elapsed clock minutes. That can be valid when measuring burden across sources. It is invalid when presented as machine downtime.
Suppose a finishing machine has these records:
Record | Start | End | Duration |
Alarm A active | 08:00 | 08:12 | 12 minutes |
Alarm B active | 08:03 | 08:15 | 12 minutes |
Verified machine stop | 08:05 | 08:10 | 5 minutes |
The sum of the alarm durations is twenty-four alarm-minutes. At least one alarm was active for fifteen elapsed minutes. The verified stop lasted five minutes.
Summed alarm duration = 12 + 12 = 24 alarm-minutes
Alarm-active union = 15 elapsed minutes
Verified stopped time = 5 elapsed minutes
All three figures can be useful. They describe different things.
A stop may continue after an alarm clears. The operator may still need to check the process and restart production. Conversely, a warning may remain active while production continues. The actual operating-state record is thus essential.
Use the ApparelDiary downtime-log guide to define reliability measures. The alarm dashboard should provide supporting event context. It should not manufacture failure events merely by renaming every warning.
Associate alarms with stops without claiming causation
A time overlap is a useful search aid. It is not proof that an alarm caused a stop.
Build a separate link table between alarm cycles and stop events. Record the basis for each link. It may be time overlap, a known machine sequence or a first-out signal. It may be an engineer's reviewed finding. Keep inferred and confirmed links distinct.
A single air-supply problem might trigger several downstream alarms. Counting
each as an independent root cause would exaggerate the failure count. The ISA application guidance discusses this issue. One process event can generate many alarms. The machine state also matters.
For a reviewed stop, identify the initiating condition where evidence permits. Keep consequential alarms as part of the sequence. Leave the cause unresolved when the evidence is weak.
Suppose three alarm sources overlap one five-minute stop. Each may have five minutes of associated overlap. Adding those three overlaps would produce fifteen minutes. That is not a valid machine total. Aggregate distinct stop intervals for stopped time.
The dashboard can show both recurrence and confirmed impact. An alarm with many short cycles may need noise reduction. A rare condition with one serious consequence may deserve higher priority. Frequency alone cannot choose the engineering response.
Make standing alarms visible at the reporting cutoff
An open alarm needs an age, not an invented final duration. Use the active timestamp as the start if it is known. Compute age from that time to the report's stated cutoff.
Suppose an alarm became active at 14:30 and remains active at 16:00. Its observed age is ninety minutes. If it later clears at 17:10, its completed active duration becomes 160 minutes. The earlier report was not wrong; it described an unfinished interval.
Keep the as-of time. Otherwise, a saved dashboard image cannot be interpreted later.
An alarm may already be active when data collection begins. The source may supply a sound original timestamp. If it does not, mark the start as earlier than the observed window. Using the first received snapshot as the activation time would understate its age.
Show active-unacknowledged and active-acknowledged cases separately. Also keep cleared-but-unacknowledged cases if they require follow-up under the site's process.
Use ageing bands as review aids, with a clear owner and next action. Do not let ack remove an unresolved active condition from the engineering queue.
Study chatter before changing alarm settings
Chatter appears as repeated active and clear transitions from the same source. A useful review view shows cycle count, active durations and gaps between cycles.
Compare the pattern with the process trace and machine state. Does it occur during a temperature ramp, at a speed change or throughout steady running? Is it linked to a worn sensor, loose connection or unsuitable setting? The dashboard should expose the pattern without assuming the cause.
Ignition's alarm-property reference documents separate active and clear delays. Those settings affect when state transitions occur. They are part of the set alarm behaviour. Comparisons across a setting change thus need context.
Do not suggest arbitrary delay or deadband values to make a count fall. A qualified engineer should review the process, response need and vendor constraints. Keep the old setting, approved change and effective time.
After an approved change, check whether nuisance alarms fell. Also check that the required detection still worked. A quiet display achieved by hiding necessary alarms is not evidence of improvement.
Keep suppression and automatic actions out of response scores
Some events may be hidden, shelved, disabled or automatically acknowledged. Those statuses affect the interpretation of counts and response times.
The Ignition journal documentation exposes settings for stored priorities and shelved events. Its event flags also distinguish a system ack. That means a journal extract may have a different scope from the screen the operator saw.
Verify the actual product version and configuration. Do not assume that a missing journal record means no process condition occurred. An ack timestamp need not prove human action. Check whether a person or the system generated it.
Keep the visibility state in the report model. Keep the ack origin and relevant settings history where available. State the limits where they are unavailable.
Keep this analytics dashboard read-only. Link users to the approved operating system for controlled actions. Its reporting filter must not silently change the machine's alarm configuration.
Design a page that leads to an inspectable case
Use a small summary area for new alarms and open conditions. Add monitored coverage and confirmed linked stops. Put the time window, operator area and event population beside those values.
Below it, provide a time plot of arrival counts and a timeline of selected stops. Add a list of standing alarms with age and status. A drill-through should show the original transition sequence.
A Pareto chart is useful for recurring sources. BestPack's dashboard documentation provides one vendor example of alarm occurrence rankings. A custom textile report needs separate views. Frequency rank differs from confirmed stop impact. Alarm priority is a third measure.
Show the remaining tail as well as the leading sources. A renamed source may appear as two rows. Fix that mapping before asking engineers to act on the ranking.
Keep colour meaning stable. Red may mean high frequency in one chart and high process severity in another. If so, give each an explicit legend. Use text labels so users can interpret exported reports as well as the live screen.
Compare like process states in a textile pilot
Consider two dyeing batches on the same machine. One has a long heat-up stage and a short hold. The other spends most of its time at a steady setpoint. Their temperature alarm counts may differ. The equipment itself may not have changed.
Link each new alarm to the batch phase at that time. This helps make the comparison fair. Show the phase duration beside its count. Do not attach every event to the phase that happens to be current when the report refreshes.
Suppose a trial records twelve activations in sixty minutes of ramping. It records six in 180 minutes of steady running. The first rate is 0.2 per minute. The second is about 0.033 per minute. The ramp has six times the observed rate in this example, even though its elapsed duration is shorter.
That finding directs a review. It does not establish that the alarms are unnecessary. The engineer still needs the process trace, set rule and required response. A recurring alert during a planned phase may be meaningful. Its settings may be poor, or a real process issue may drive it.
Keep clock uncertainty visible when reviewing a sequence from several controllers. If one controller is known to be two minutes slow, an apparent first alarm may not truly be first. Keep the original timestamp and any approved correction. Do not reorder events by guesswork to create a neat causal story.
The pilot should finish with a short list of reviewed cases. For each, record the evidence, decision and expected follow-up measure. The next review then has concrete questions. Did the confirmed cause change? Did unwanted repetition fall? Did required alarm detection still work?
Validate the dashboard with a small event replay
Prepare a controlled dataset before connecting the report to daily reviews. Include one normal cycle. Add a case that clears before ack. Add two overlapping alarms and a confirmed stop.
Add a duplicate transfer row and a genuine rapid repeat. The duplicate should not raise the activation count. The genuine repeat should remain visible.
Test an alarm active before the period and one open at the end. Add a missing clear record and an gap in the data. Verify that none becomes a fabricated completed duration.
Test the exact window boundary and the twelve-alarm burst across two fixed bins. Check that fixed and rolling results differ for the stated reason.
Finally, trace one summary value back to its raw records. Production should confirm the stop interval. Engineering should confirm the alarm meaning. The data owner should explain grouping, filters and time handling.
Keep this test set with the report logic. Rerun it when a source adapter, clock rule or metric definition changes. It gives the team a compact way to detect a silent change in meaning.
Common questions
Can ack time be called repair time?
No. It records an ack under the source system's rules. Repair and return to service need their own evidence and definitions.
Can alarm durations exceed the length of a shift?
Summed durations across overlapping alarms can. Label them alarm-minutes. Use distinct operating-state intervals for machine stopped time.
Does a high alarm count prove poor machine reliability?
No. Counts can reflect repeated messages, configuration or operator exposure. Reliability claims require defined failures and valid operating-time data.
Should all machines share one flood threshold?
The approved monitoring rule should reflect the responsibility and process being checked. A fleet-wide count alone does not establish what any one operator experienced.
Conclusion
A useful alarm dashboard keeps three things distinct. These are state changes, alarm cycles and production stops. Count activations carefully, define burst windows and keep unfinished states. Link alarms to stops with explicit evidence. Engineers can then study recurring conditions while production sees confirmed impact. Each number remains tied to a question the data can actually answer.
Alarm data supports reliability work, so see MTBF and MTTR calculation, preventive versus predictive maintenance, factory KPI dashboard design and the manufacturing analytics stack.
References
ISA: alarm-management standards and technical-report series.
ISA: applying alarm management to different process contexts.
OPC Foundation: alarm terms and definitions.
OPC Foundation: example event sequence for one Condition.
Inductive Automation: Ignition 8.3 alarming model.
Inductive Automation: Ignition 8.3 Alarm Journal.

Discussion0
Loading the discussion…