
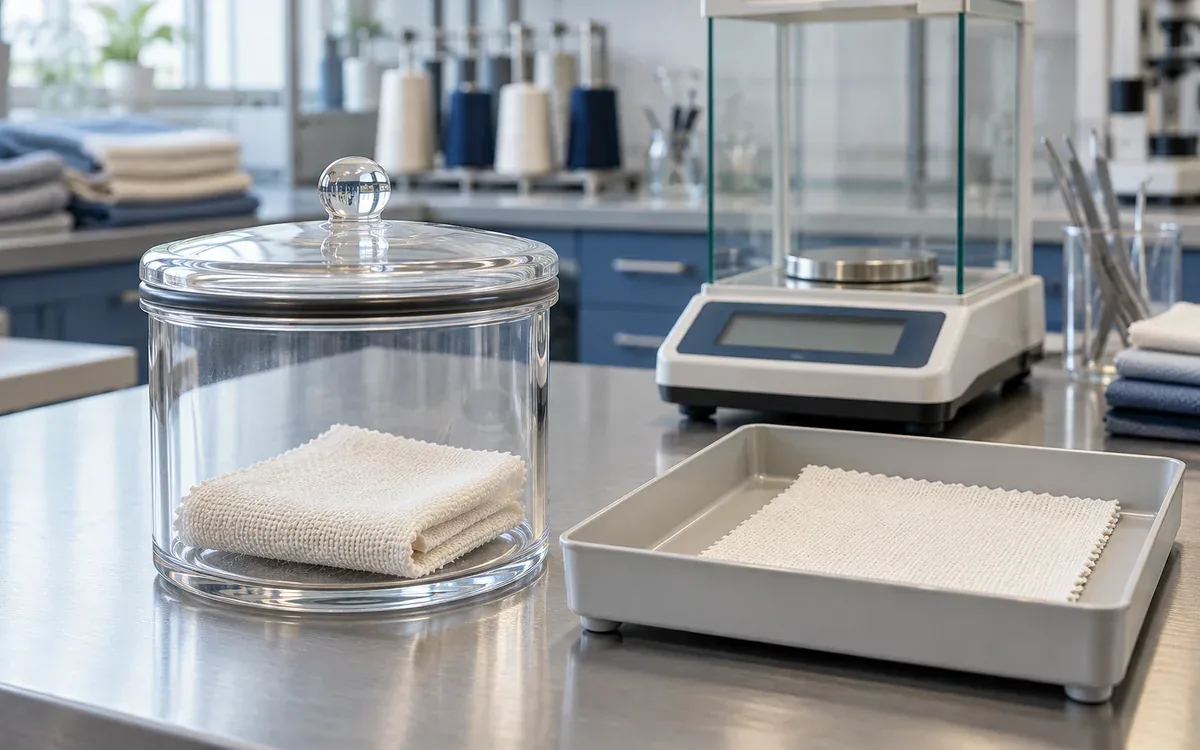
Fabric Moisture Regain and Receiving Weight Checks
Calculate regain and content on their different mass bases and distinguish measured moisture from commercial allowances. A laboratory handover record preserves the condition each result describes.
Garment Factory Calculators and Guides
Industrial Engineer & Business Process Optimization Executive
Salauddin Ahamed Sagar is an industrial and production engineer in Dhaka, Bangladesh, specializing in ready-made garment manufacturing, ERP systems, and industrial engineering. He leads ERP and process optimization projects at Apex Holdings Ltd. and previously worked in line balancing and industrial engineering at Epyllion Group and Young Group. He holds a BSc in Industrial and Production Engineering from NITER (University of Dhaka) and founded Apparel Diary to share practical engineering methods, calculators, and factory operations guides.
Calculate regain and content on their different mass bases and distinguish measured moisture from commercial allowances. A laboratory handover record preserves the condition each result describes.
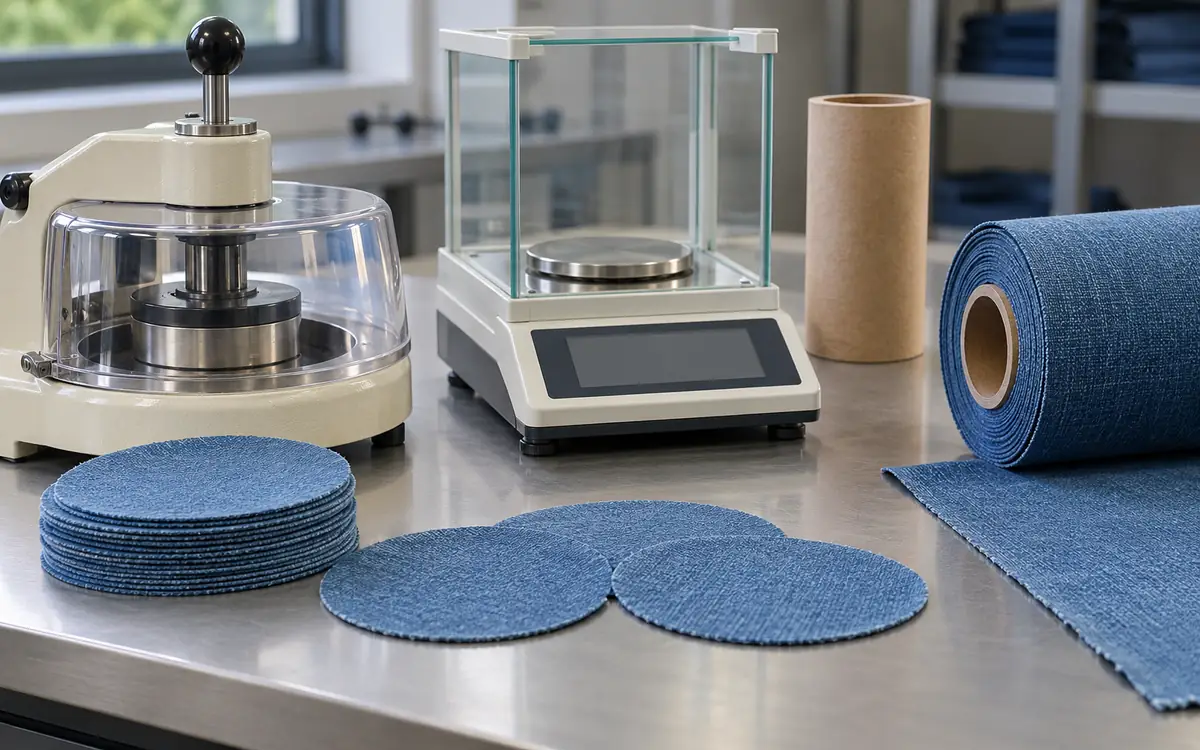
Check specimen-area conversion and compare net roll mass with a matching fabric-area basis. A segment-weighted example explains why a simple average can create a false discrepancy.

Check cutting width before releasing a marker. Compare usable and nominal fabric width, edge exclusions and roll measurements with worked factory examples.

Control roll identity, quantity, laboratory status and release authority with a shared receiving record. A worked delivery example exposes discrepancies hidden by shipment totals.

Control hydrogen peroxide bleaching of cotton with active-content checks, bath profiles, whiteness and strength trials, and peroxide cleanup release limits.

Choose which spare parts to stock, share or source using consequence, recovery time and technical compatibility. An illustrative cost screen separates annual holding cost from avoidable outage exposure, while the decision matrix and receiving controls keep safety-critical items.
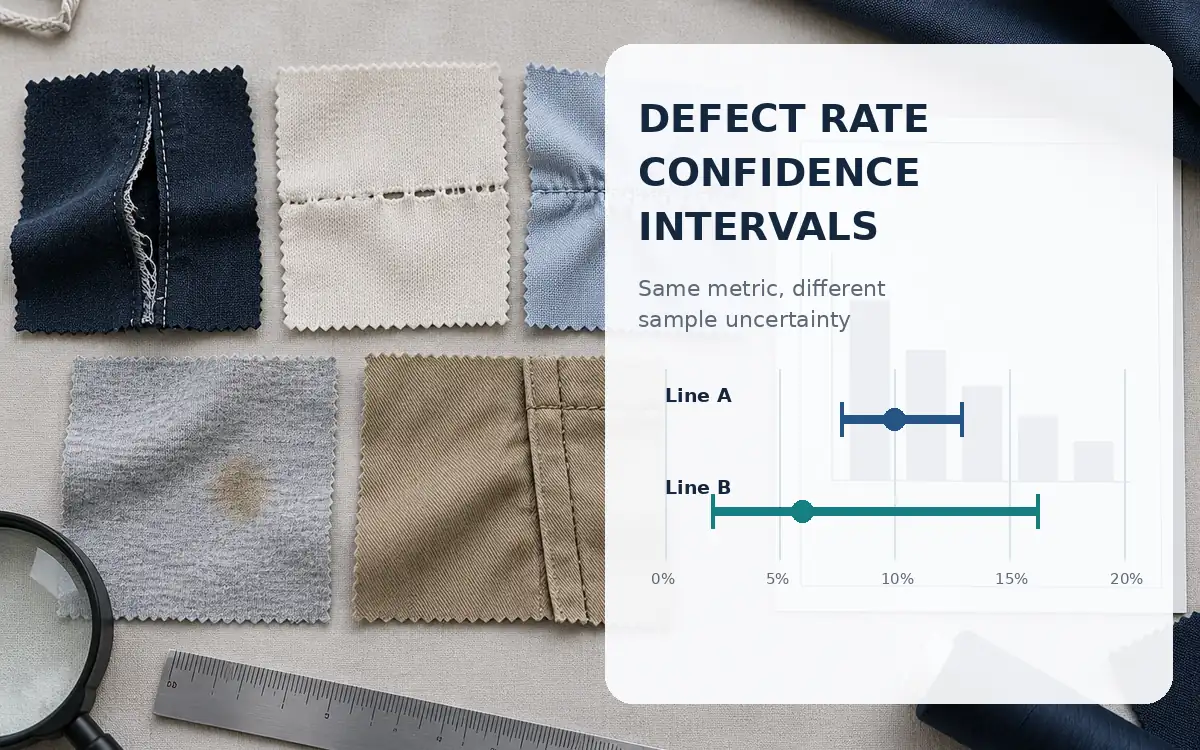
Calculate a Wilson confidence interval for a sampled defective-unit rate and report it with the sample count. Examples show why a small sample with a lower percentage may still be inconclusive, why zero observed defects is not proof of zero risk.

Turn defect records into a Pareto chart with correctly sorted counts and cumulative percentages. A second ranking by illustrative rework minutes shows why the most common fault may not consume the most capacity, while the action worksheet keeps suspected causes separate.

Build an expediting decision from the actual line-readiness deadline, action-specific delay probabilities and incremental recovery costs. A worked trims example calculates the premium's break-even probability reduction and records the evidence, approval owner and fallback needed