

The sewing report shows 1,060 pieces. A supervisor corrects three order lines. The replacement file shows 1,100 pieces. After the next Excel refresh, the dashboard reports 2,160 pieces.
Nothing was sewn twice. The workbook added two versions of the same shift summary.
Power Query can combine daily CSV files for a production report. First, agree what each row means. Decide how to choose the current version. Write those rules in a file contract. The folder is only the collection point. It is not the rule for deciding whether two records should be added together.
This guide builds an original workbook workflow for revised shift-summary files. It shows which files to use and how to check their columns. It then deals with types, revisions, and rejected rows. The final steps check the totals and build the dashboard. The quantities and filenames are hypothetical.
Decide whether the files contain events or snapshots
An event file contains separate transactions. Give each transaction a stable unique ID. Check for repeated deliveries. New valid events can then be added as rows under the agreed rules.
A snapshot file contains the current state at a stated time. A later snapshot may replace an earlier one. Appending both and summing them can double-count the same work.
The worked files contain shift summaries. Each row describes accepted output for one order line at one department. Plant, production date, and shift further define the row. A later approved revision replaces the earlier summary for that reporting scope.
Write that definition at the top of the data contract. Ask the source owner to confirm it before building queries.
Do not infer snapshot behaviour from a filename that says “daily.” Some daily exports contain only that day's new events. Others contain the whole order-to-date balance.
Read ApparelDiary's manufacturing analytics stack guide for the wider system design. It starts with how data is captured and stored, before the choice of dashboard tool. The event-versus-snapshot distinction is one of those decisions.
Define the row and the file together
The row key in this example contains PlantID, ProductionDate, ShiftCode, DepartmentCode, and OrderLineID. OrderLineID must distinguish the required style, colour, and size scope in the source.
A file also needs an ExportID, Revision, and source export timestamp. These identify the delivery and its intended precedence.
Field | Proposed rule | Why it matters |
PlantID | Controlled text code | Prevents mixing similarly named plants |
ProductionDate | Agreed ISO date format | Avoids ambiguous day/month parsing |
ShiftCode | Controlled text code | Preserves the intended reporting period |
DepartmentCode | Controlled text code | Separates stages that may count the same garment |
OrderLineID | Stable text identifier | Keeps leading zeros and variant identity |
GoodPieces | Nonnegative whole number | Defines the measure being summed |
Revision | Approved increasing integer | Identifies the current snapshot version |
ExportID | Unique source delivery identifier | Detects repeated file delivery |
Specify whether a revision replaces the whole file scope or only selected rows. The worked design uses full replacement for one plant–date–shift–department scope.
That matters when a corrected export removes an order line. A query might take the highest revision seen for each row. That rule could keep a removed line from an older file. Select the latest complete export first. Under this contract, that choice avoids the error.
Keep the dashboard measure narrow
GoodPieces means accepted output at the specified department checkpoint in this example. It is not automatically first-pass quality, labour efficiency, or shipped quantity.
The same physical garment can appear as accepted output in sewing and later in finishing. Do not add the two department totals and call the result total garments produced.
Show department as a required filter or as clearly separated panels. Managers may also need one factory output figure. Choose a single checkpoint that represents that output.
Keep rework visits, repairs, and transfers out of this measure by default. Include them only when the source contract explains how to count them. A repaired garment may pass the checkpoint again. It must not count as another new garment.
The workbook should reveal the chosen definition in a small notes area. A clear unit and checkpoint are more valuable than a decorative gauge labelled “performance.”
Create a controlled landing folder
Use a folder intended for production extracts. Keep unrelated spreadsheets, backup copies, and test files outside the query's permitted path.
Microsoft documents that the Folder connector includes files in subfolders. Filter the file list before combining when some paths or file types must be excluded. Folder connector guidance
For the example, accept only approved CSV exports for the required source. Exclude temporary files and a separate archive path used for unrelated material.
Do not rely solely on file modification time to choose the latest business revision. Copying a file can change file-system metadata without changing its source meaning.
Retain the source filename and folder path in the query output. Also retain the ExportID from the source contract. Those fields let the team trace a surprising total back to the delivered file.
Protect the landing process from half-written files. The source must finish writing before it releases a file. Agree how that handover will work in the plant's system.
Inspect the file list before combining
In Excel, connect to the folder. Choose the transformation route to review the file list. Check the extension, path, naming pattern, and expected reporting scope.
Create a file-manifest query that lists accepted and excluded files with reasons. A file outside the scope should be visibly excluded, not forgotten.
Compare the inventory with the expected deliveries. If six departments must send a shift report, five valid files do not make the dataset complete.
Keep “no production” distinct from “no file received.” An inactive department should still confirm its status. It could send a zero-output report or use another agreed method.
Do not infer zero from absence. That would turn an interface failure into an apparently poor production result.
The manifest should show the expected scope and received ExportID. Add the revision, file status, and parsed row count. Include the source control total if one is available.
Choose a representative sample file
Power Query uses an example file to build the combine-files steps. It applies those steps to the selected files. Microsoft describes files that share a schema. That means their columns have a common structure. Check the generated steps when headers or types change. Combine-files overview
Choose a valid file that represents the current contract. Do not use an empty export or a special one-off report with extra title rows as the sample.
Check delimiter, encoding, header location, and quoted text. A comma inside a properly quoted description should not become another column.
In the generated sample transformation, remove only the rows that the contract defines as non-data. Avoid “remove the first four rows” if some files have three header lines and others have five.
Microsoft's CSV combination example shows a linked set of steps. A change in the sample query may require a change in a later expansion step. Review those generated steps rather than assuming the final query will repair itself.
Validate the schema before accepting rows
List the required columns and their meanings. Compare each file's headers with that list before using its values.
If GoodPieces is missing, reject the file for correction. Do not create a zero-filled replacement column just to keep the refresh running.
Decide how to handle extra columns. A harmless added note may be acceptable under a controlled rule. A new quantity column called “NetGoodPieces” needs closer review. What does it mean? Check that before it replaces the old measure.
Support known schema versions explicitly. For example, version two may rename a field after an agreed source change. Keep a mapping for that version and test it. Do not match headers by vague similarity.
Record schema failures at file level. The manifest should show that the file was received but could not be accepted. That is different from a missing delivery.
This design makes the source change visible while the affected scope remains unresolved.
Assign data types deliberately
Treat identifiers as text even when they contain only digits. An order line “000731” is an identity, not a quantity.
Use a date type for ProductionDate and whole numbers for GoodPieces and Revision. Keep the source timestamp in a suitable documented type.
Power Query can infer types. For unstructured sources, Microsoft recommends setting output types explicitly. Locale affects how text values are interpreted as dates and numbers. Power Query data types
Use the contract's stated date format and culture. A value such as “03/04/2026” cannot be safely interpreted without that context.
Test leading zeros and blank values. Check numbers with thousands separators or decimal commas. Also try text in a quantity field. A value such as “two hundred” should not silently become zero.
Keep the original text beside a conversion error in the rejected-row output. That helps the source owner correct the actual input.
Separate rejected rows from accepted data
A step-level error can stop a query. A cell-level error can affect particular values. Microsoft distinguishes those cases in its error-handling guidance. Dealing with Power Query errors
Build a query for rejected rows. Keep the source file, ExportID, and row key. Add the original value and rejection reason. Typical reasons include missing keys, invalid dates, negative quantities, and unsupported revisions.
The accepted query should contain only rows that passed the defined checks. The dashboard must also show whether rejected data makes the selected scope incomplete.
Do not use “remove errors” as a complete quality policy. Removing a 500-piece row can make a report look tidy while understating output.
The combine dialog offers a way to skip files with errors. If used, the manifest still needs to identify every skipped file and its effect. A successful refresh must not hide those omissions. Combine-file error option
Missing data may make the report unsafe to use. Follow the agreed reporting rule. Keep the last approved snapshot with a clear date, or show the affected scope as incomplete.
Select the latest complete revision
Use the source's approved revision field within each file scope. The contract says a new export replaces the whole old one. Do not pick the latest version of each row across all files.
First identify the highest accepted revision for a scope. Then ensure that only one approved export represents that revision. Finally, take all rows from that export.
Two files may claim the same ExportID and revision. Check whether one is a repeated delivery. If their content differs, treat it as a conflict. Do not choose whichever filename sorts last.
Preserve superseded exports in the manifest. They remain useful evidence. Their rows no longer contribute to the current dashboard.
A later revision can reduce quantity. That is not automatically an error. The source owner may have removed a duplicate or corrected an invalid acceptance. Keep the revision explanation available.
Work through the two-version example
The first export contains three order lines. The corrected export replaces the same complete scope.
Order line | Revision 1 | Revision 2 |
OL-A | 600 | 620 |
OL-B | 270 | 280 |
OL-C | 190 | 200 |
Total | 1,060 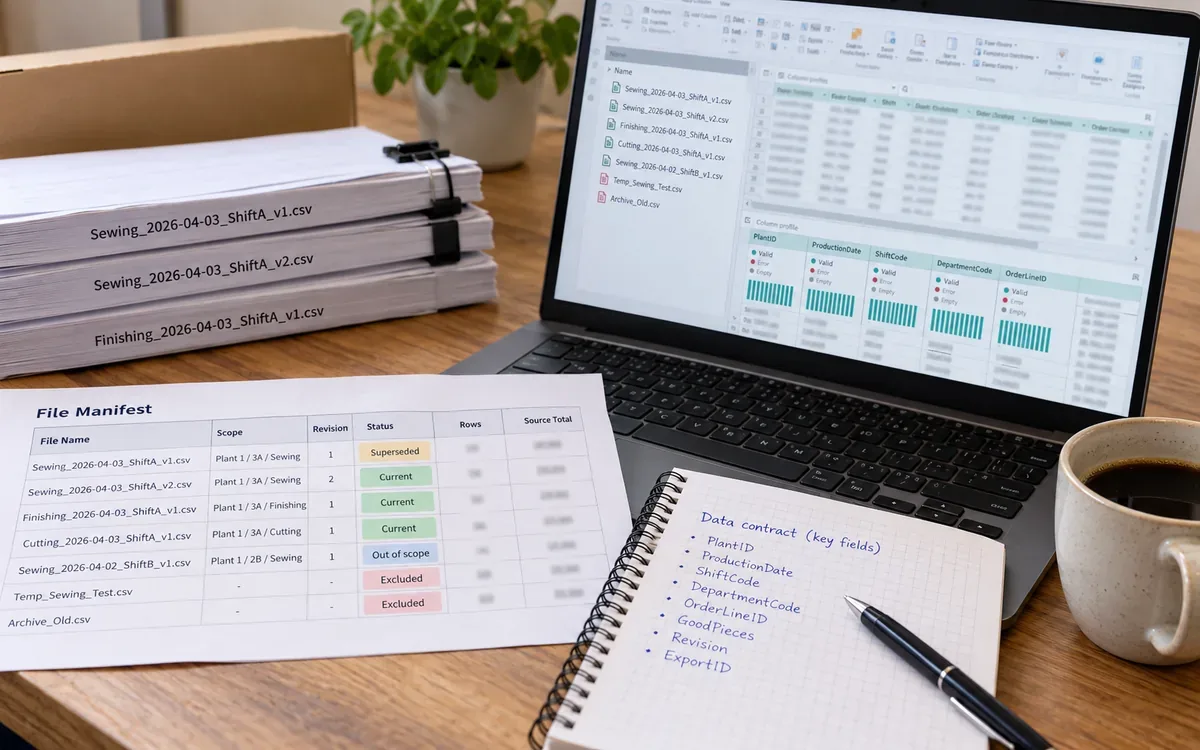 | 1,100 |
The correct current total is:
Current accepted pieces = 620 + 280 + 200 = 1,100 pieces.
Appending both snapshots produces:
Incorrect total = 1,060 + 1,100 = 2,160 pieces.
The valid change is much smaller:
Approved revision change = 1,100 − 1,060 = 40 pieces.
The manifest should account for all six parsed rows. Three are superseded. The other three are current. The current dashboard uses only Revision 2.
Now suppose Revision 3 legitimately removes OL-C. Under the whole-file replacement contract, OL-C must disappear from the current scope. It must not survive merely because its highest previously seen row revision was two.
That second test checks the replacement rule. Finding a maximum row number alone would fail it.
Reconcile files rows and quantities
Use several checks because each reveals a different failure.
The file check compares expected scopes with received and accepted exports. The row check compares three counts: source rows, parsed rows, and accepted rows. The quantity check compares the source's declared total with the sum of current accepted rows.
For Revision 2, the expected row count is three and the expected quantity is 1,100 pieces. Both should match.
A quantity match alone can hide a missing row offset by an extra row. A row-count match can hide incorrect quantities. Keep the key set as well as the totals for important scope checks.
A clean-data percentage does not prove that the total is complete. This matters most when the missing quantity is unknown. Report what is known: for example, “three rows accepted; one row rejected with an unreadable quantity.”
Set a clear release rule for unresolved files. The workbook should make the status visible before managers use the number in a meeting.
Load one accepted table for reporting
Load the current accepted rows into a clearly named Excel table, such as Production. Raw staging queries can stay as connections where that suits the design. Put the manifest and rejected rows on separate review sheets.
Use one controlled accepted table as the source for PivotTables and formulas. Avoid several slightly different copies built by separate analysts.
For a simple plant–date–department total, an illustrative formula is:
=SUMIFS(
Production[GoodPieces],
Production[PlantID], $B$2,
Production[ProductionDate], $B$3,
Production[DepartmentCode], $B$4
)
Cells B2, B3, and B4 hold the selected plant, true date value, and department code. The formula sums only rows matching all three criteria.
Microsoft documents SUMIFS as a sum across multiple matching criteria. SUMIFS reference
Test the formula against a visible filtered detail table. Confirm that the chosen date is a date value, not text that only looks like one.
Design the dashboard around the next question
Start with accepted pieces by shift, order line, and department. Give data status its own visible panel on the first sheet.
Show the selected production date and latest accepted revision. Add the last workbook refresh time. Show how many expected files arrived and how many rejections remain open. These explain the state of the number.
Use a trend chart for comparable daily output. Use a bar chart to show each order line's contribution. Keep the department boundary clear. A stacked chart may combine sewing and finishing. Its total could count the same garments twice.
Provide a route to the accepted detail rows and the source manifest. A supervisor should be able to find which file contributed a disputed figure.
Check a target's period and scope against the actual measure. Do this before adding a red/green target indicator. A daily department total and a whole-order target cover different scopes. Define a valid comparison before placing them side by side.
Check the whole dataset during development
Power Query's profiling tools can show valid, empty, and error values. Microsoft notes that profiling uses the first 1,000 rows by default. You can change that setting to cover the entire dataset. Data profiling guidance
A clean preview is therefore not proof that every row is clean. Use full-dataset checks or explicit validation queries for the acceptance rules.
Place a deliberately invalid row beyond the first 1,000 rows in a test extract. Confirm that the validation process finds it. This is an original test suggestion, not a claim about a supplied workbook.
Also test an unexpected column, a blank file, a duplicated export, and a revised file that removes a row.
Keep these test files outside the live landing scope. They should demonstrate failure handling without contaminating the production dashboard.
Make refresh and publication separate steps
Refreshing queries updates the workbook's data. Publishing a number to the morning meeting is a business release decision.
After refresh, check the manifest, rejected rows, source totals, and current revision selection. Confirm that the PivotTables and charts reflect the accepted table.
Record the approved reporting snapshot and the reviewer where the process requires it. A source may send a correction during the meeting. Label the newer revision. Make clear which figure the team is discussing.
Keep a visible “data through” statement based on the accepted source coverage. The workbook's current clock proves little about source coverage. It does not confirm that all departments have reported.
If refresh fails, retain a clear stale-data message. A chart left on screen from yesterday should not appear to represent today's completed update.
Protect the transformation from routine edits
Keep source values out of formula cells. Do not let routine workbook edits change query output columns. A manual edit inside the loaded table may vanish at the next refresh. It may also leave no reliable history.
Route source errors back through the agreed correction process. An approved reporting adjustment may sometimes be needed. Store it in a separate controlled table. Give it an ID, reason, quantity, date, and approval record. Make its effect visible.
Document where to set the folder path and who can change it. List the supported source schemas. Use a parameter or controlled setting suited to the workbook's environment.
Keep a small change log for query revisions. Changing from row replacement to whole-file replacement changes the logic. Record and test that change even if the chart looks the same.
Keep a known test dataset and its expected results. Another owner can use it to check the workbook after an edit.
Plan for growing file volume
As the folder grows, measure refresh time and the work needed to review exceptions. An easy first week does not prove that the workbook will always suit the task. Review its limits as the work grows.
Agree how long to keep files and where to archive them. Preserve the evidence needed to explain past reports. The query may need old inputs to rebuild the accepted dataset. Check that dependency before moving files.
A data platform may later take over the file intake. Keep the same row definitions and revision rules. Preserve the rejected-data evidence too. A move to a database should improve the operating process without changing the meaning of output.
The workbook's contract and test cases become useful migration material. They explain which behaviours the replacement system must reproduce.
Choose that move from actual scale, reliability, and support needs. The purpose is a dependable production report, not a particular technology label.
Common questions
Can I combine files with different column orders?
A controlled transformation can use column names. The columns must still mean the same thing across files. Test the schema before accepting them. Check the generated expansion and types rather than assuming all differences are harmless.
Is the newest file modification time the latest production revision?
Not necessarily. Copying or restoring a file can change that timestamp. Use the source's approved revision and export identity.
Should a missing department file count as zero output?
No. Missing evidence and confirmed zero activity are different states. Show the missing scope until it is resolved.
Can I remove duplicate rows after combining?
Only after defining why they are duplicates and which version should remain. Arbitrary removal can retain the wrong snapshot or hide a conflicting export.
Keep the source explanation beside the total
A useful Excel dashboard can explain its 1,100-piece total. Here, it comes from three current rows in one approved export. It should also explain why the earlier 1,060-piece version no longer contributes.
Start with a stable file contract and clear data types. Choose revisions under a known rule. Keep rejected data visible. Together, these steps make the total easier to explain. Build these parts before polishing the chart. Keep them visible during the daily production review.
Dashboard design guidance applies here, so see factory KPI dashboard design, the operations dashboard, line efficiency and the manufacturing analytics stack.



Discussion0
Loading the discussion…